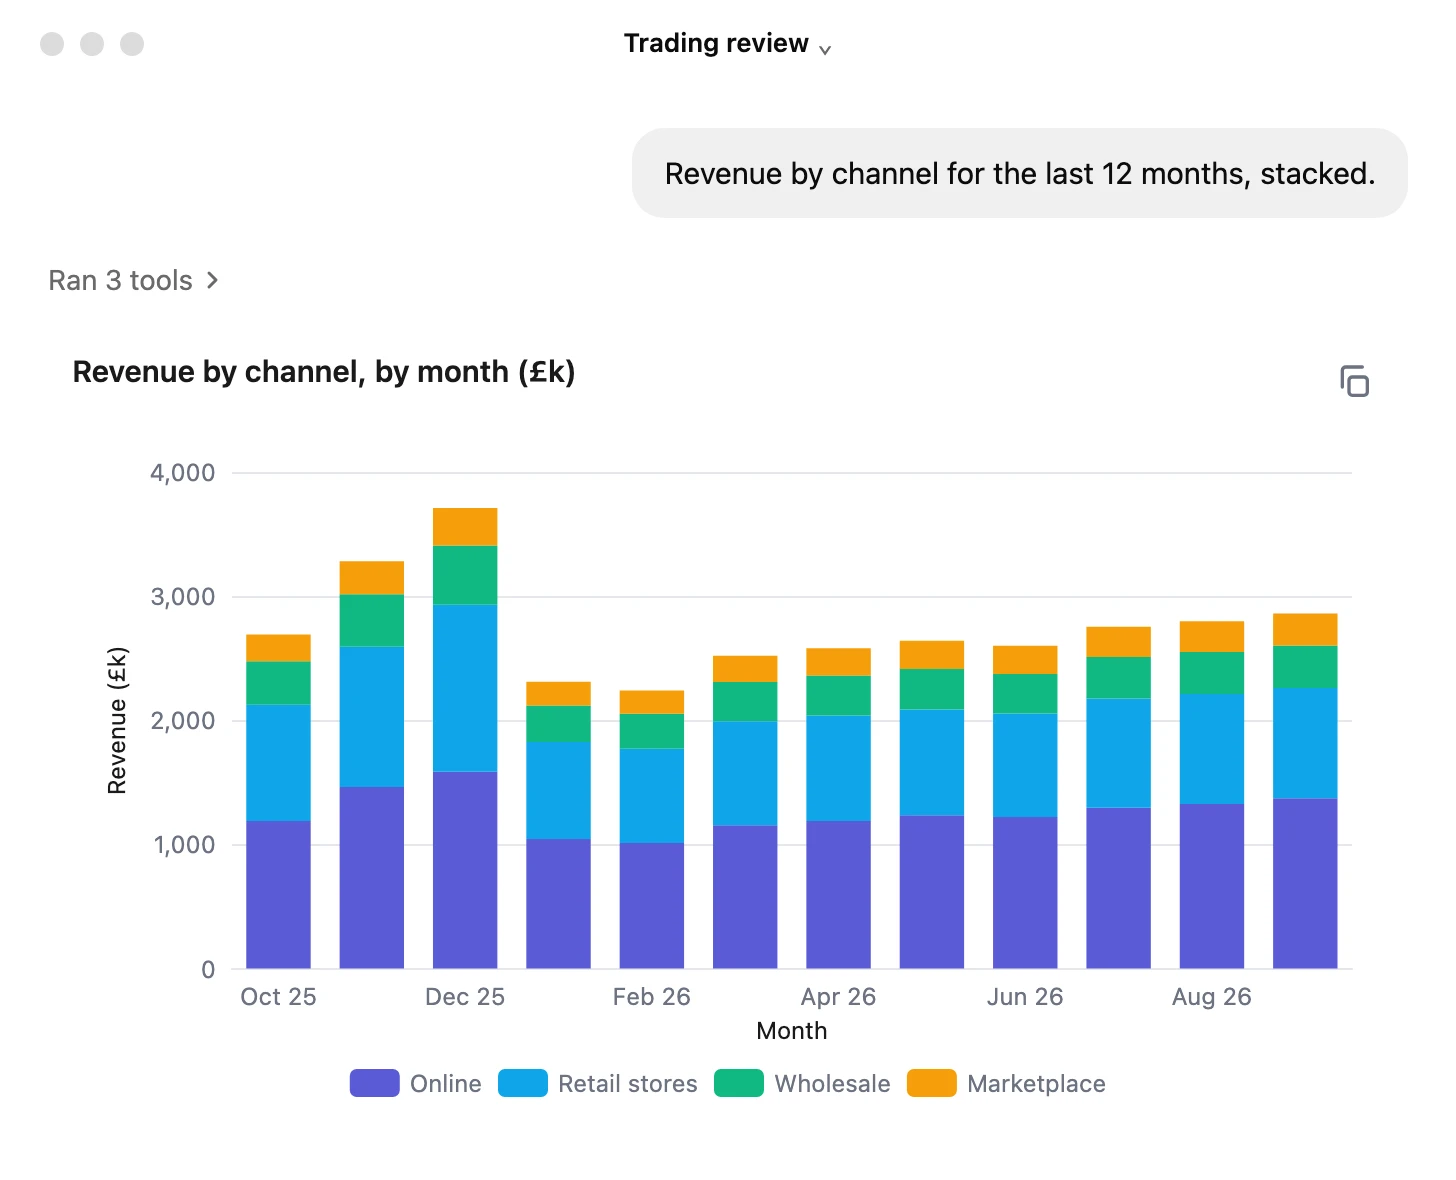
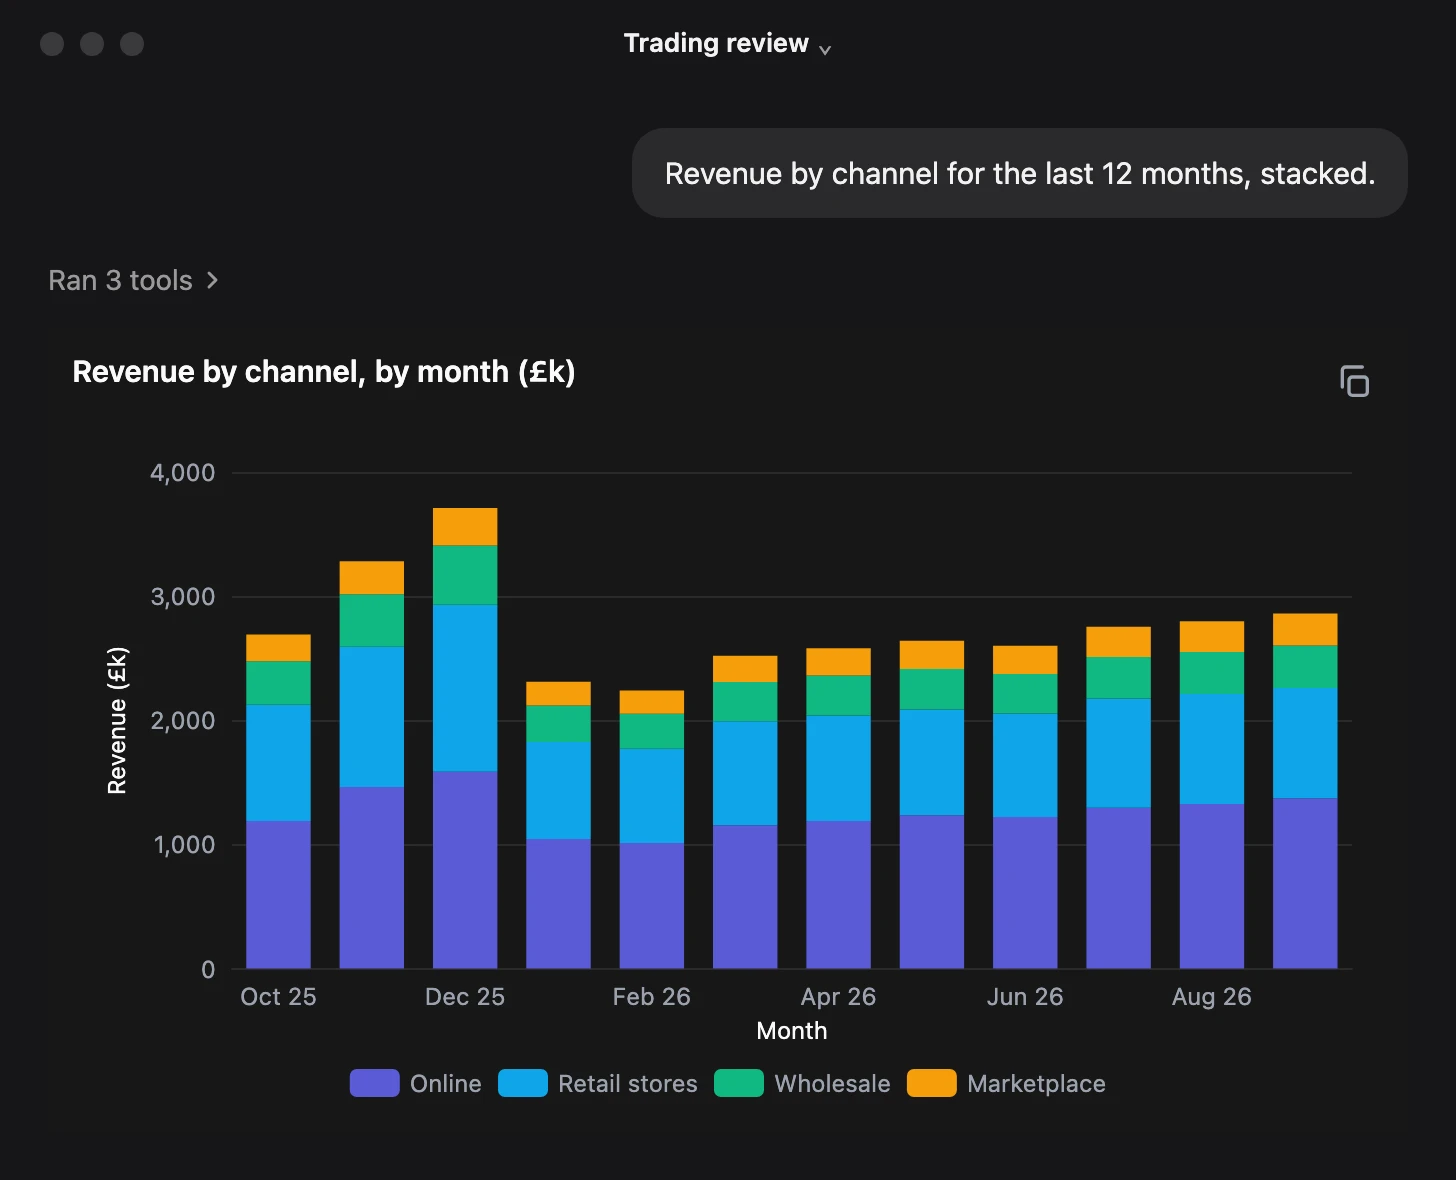
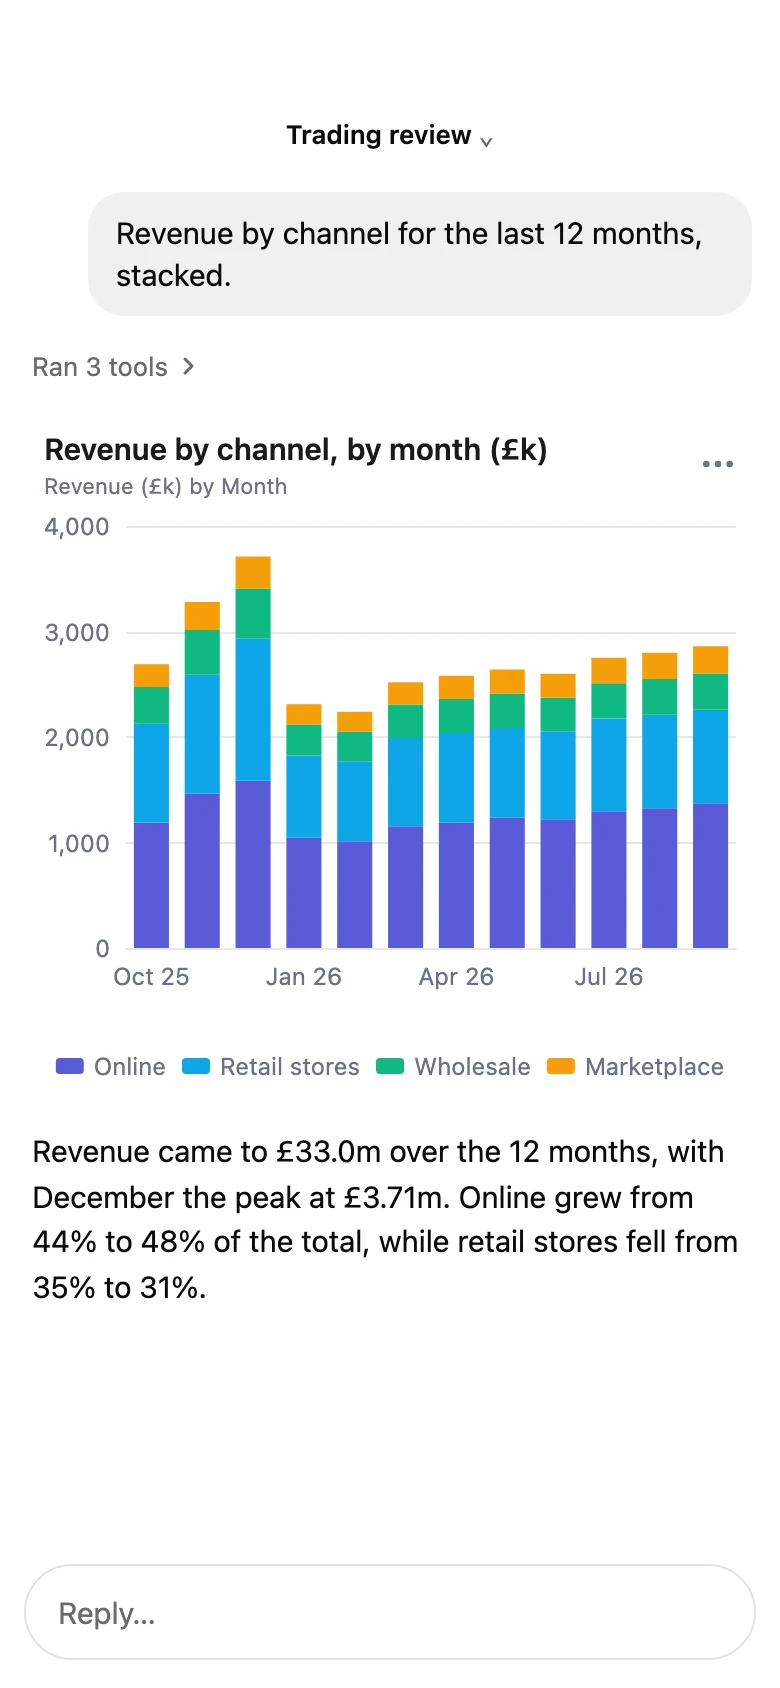
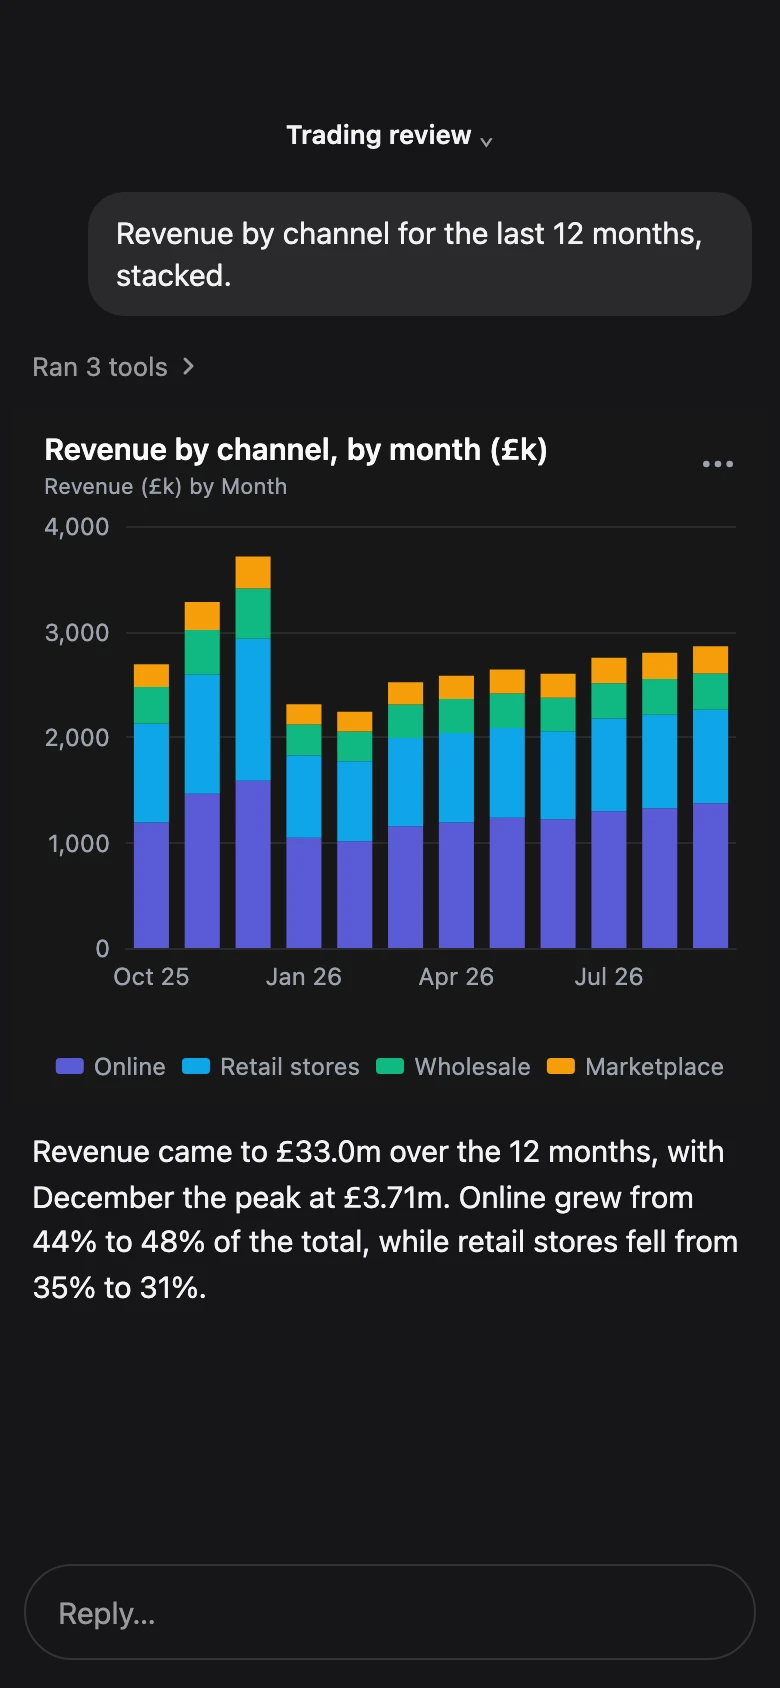
Stacked bars. Stacked, grouped or side by side.
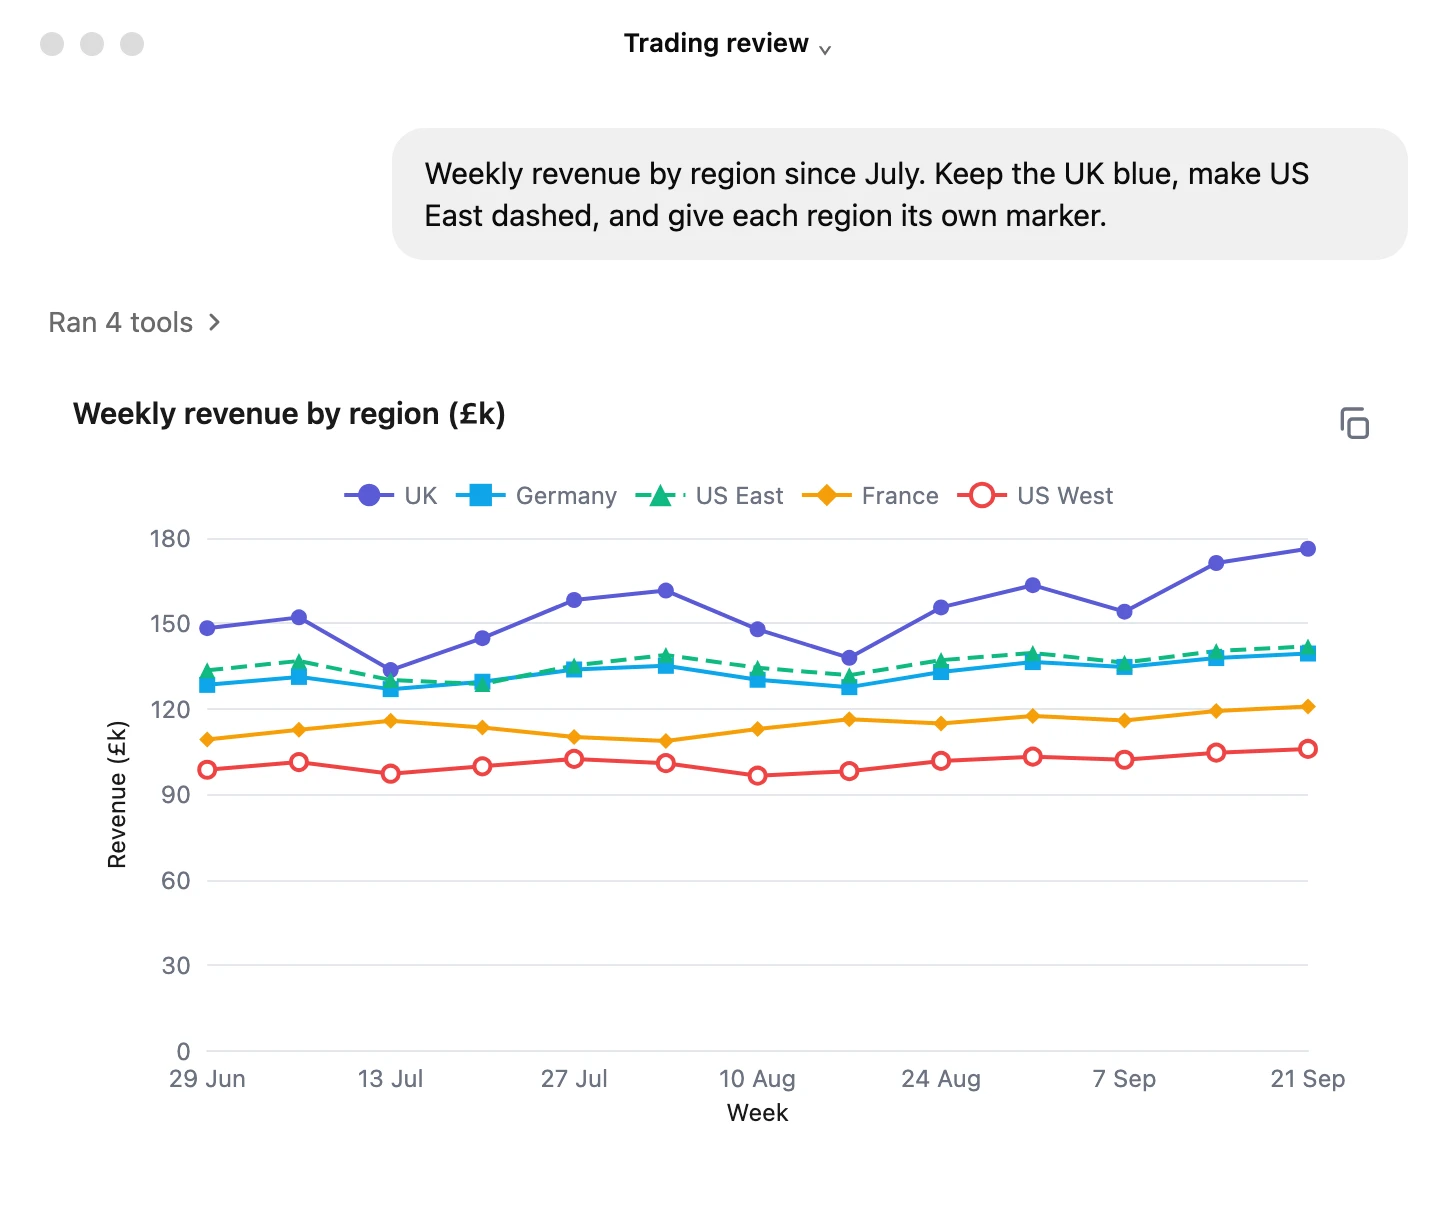
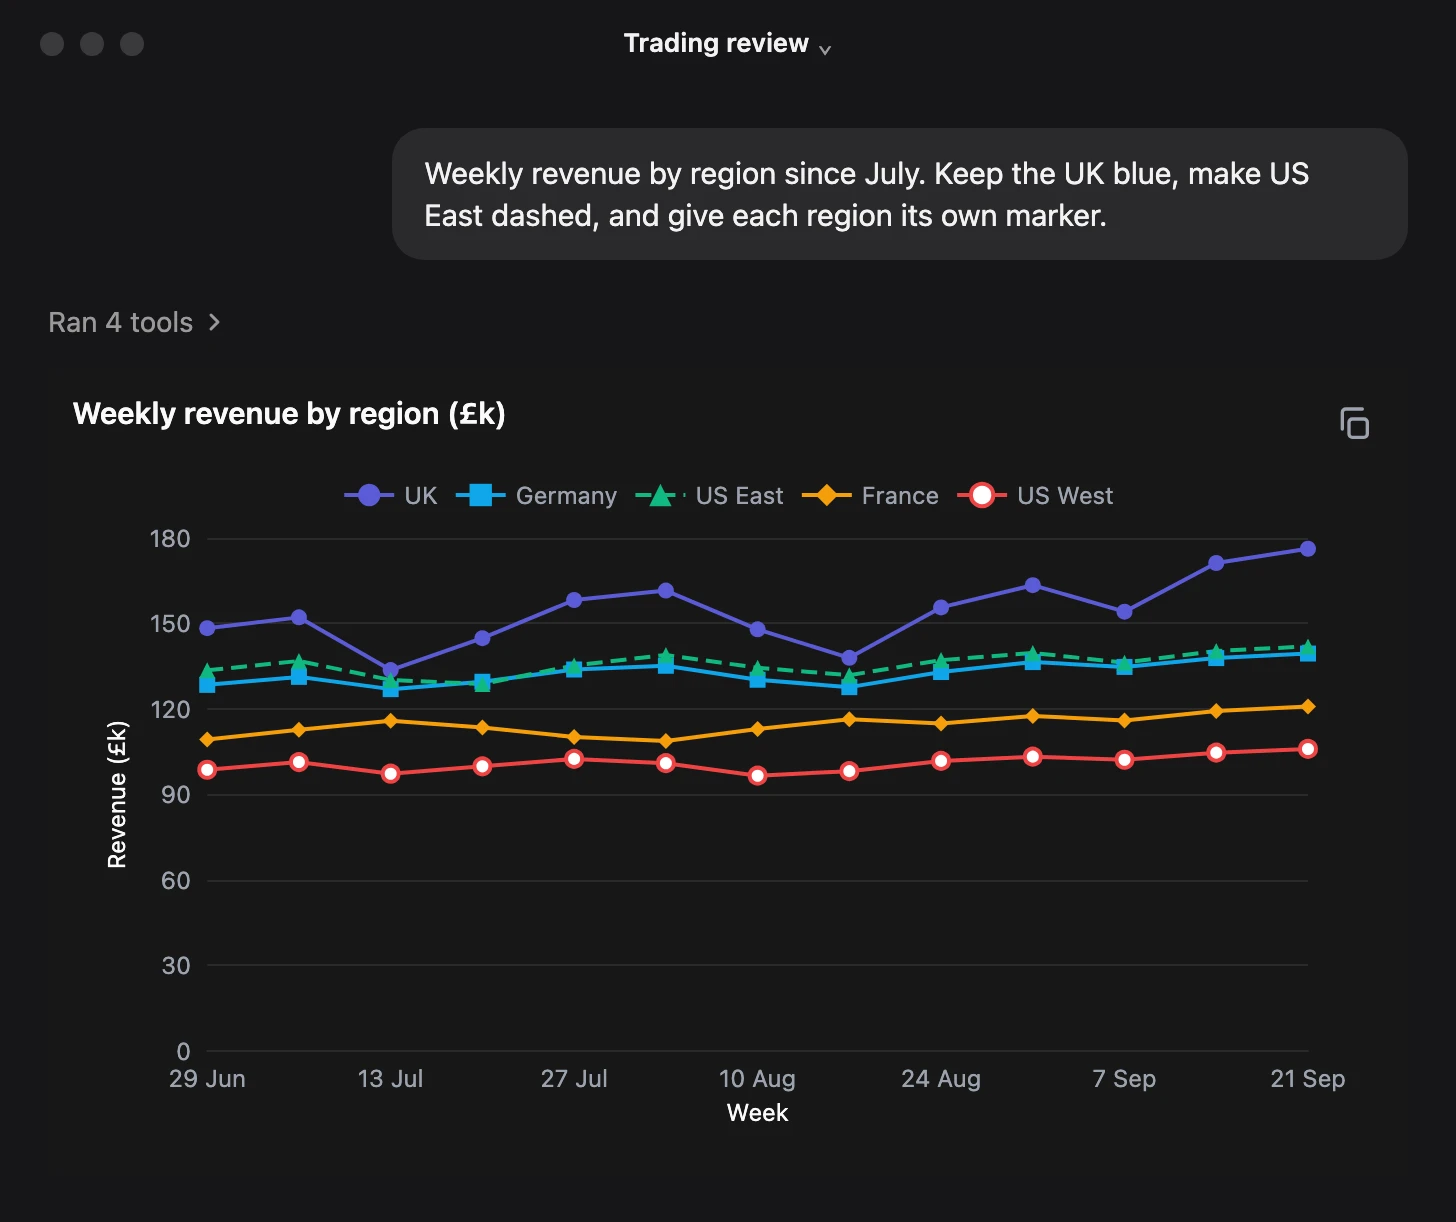
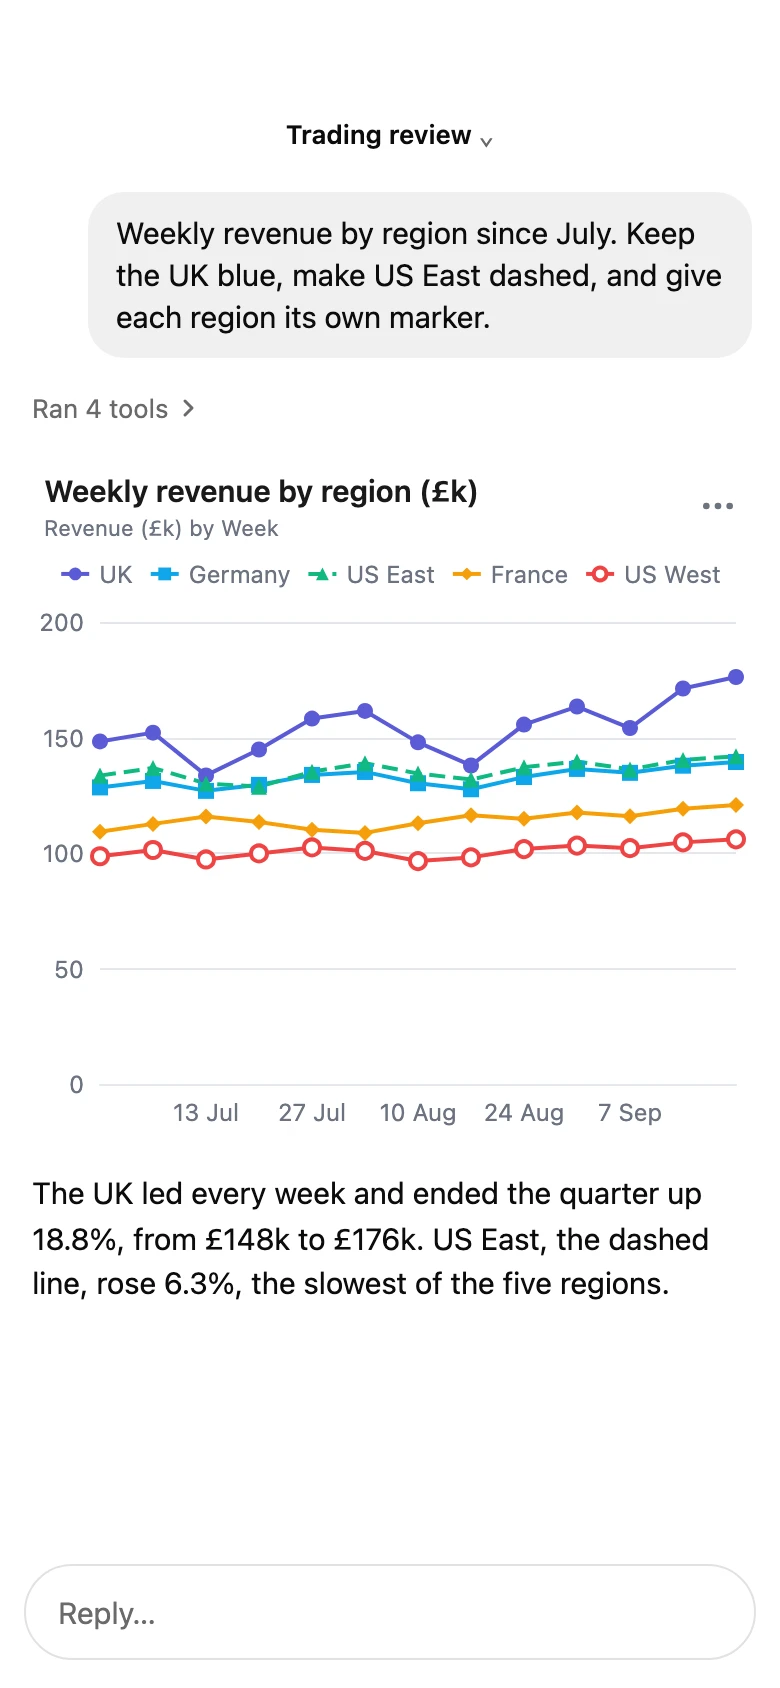
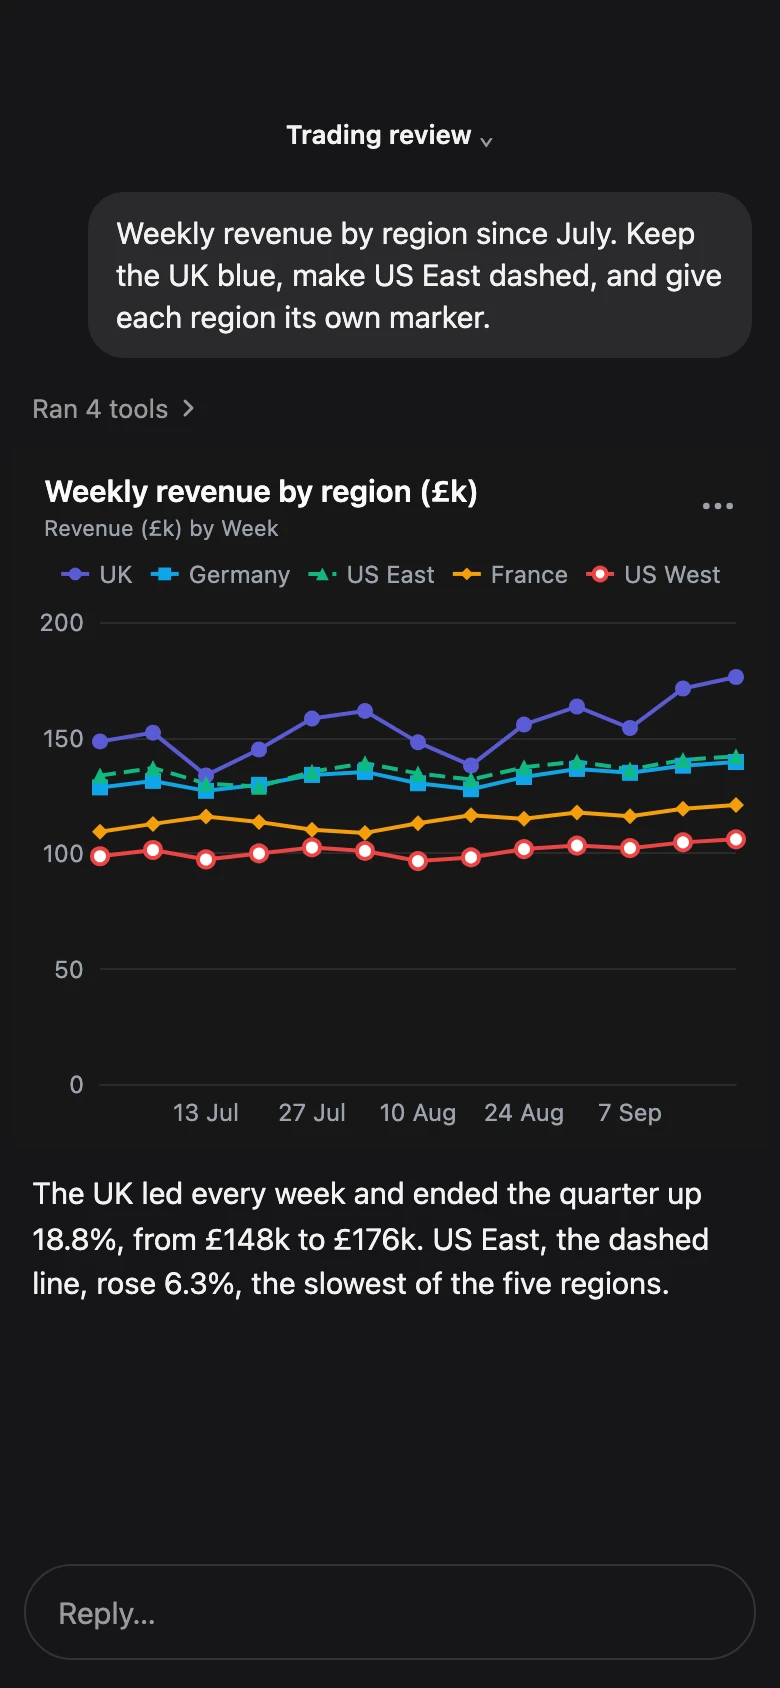
Styled series. Your colours, dashes and markers.
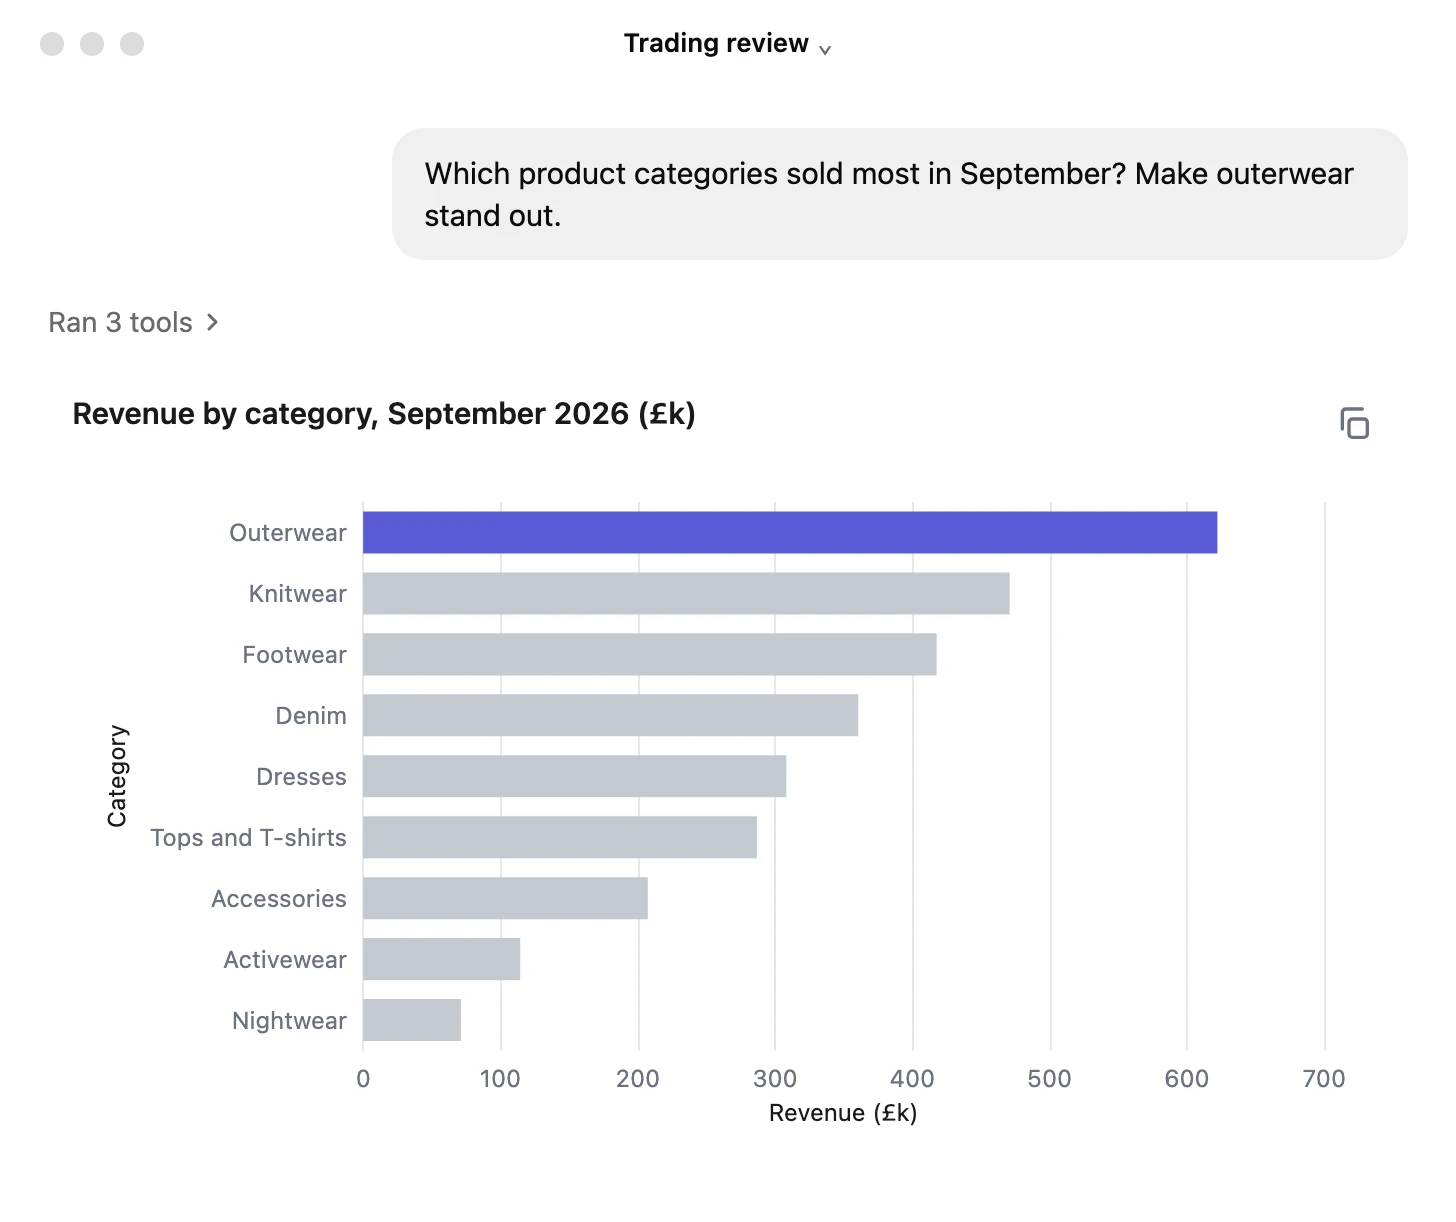
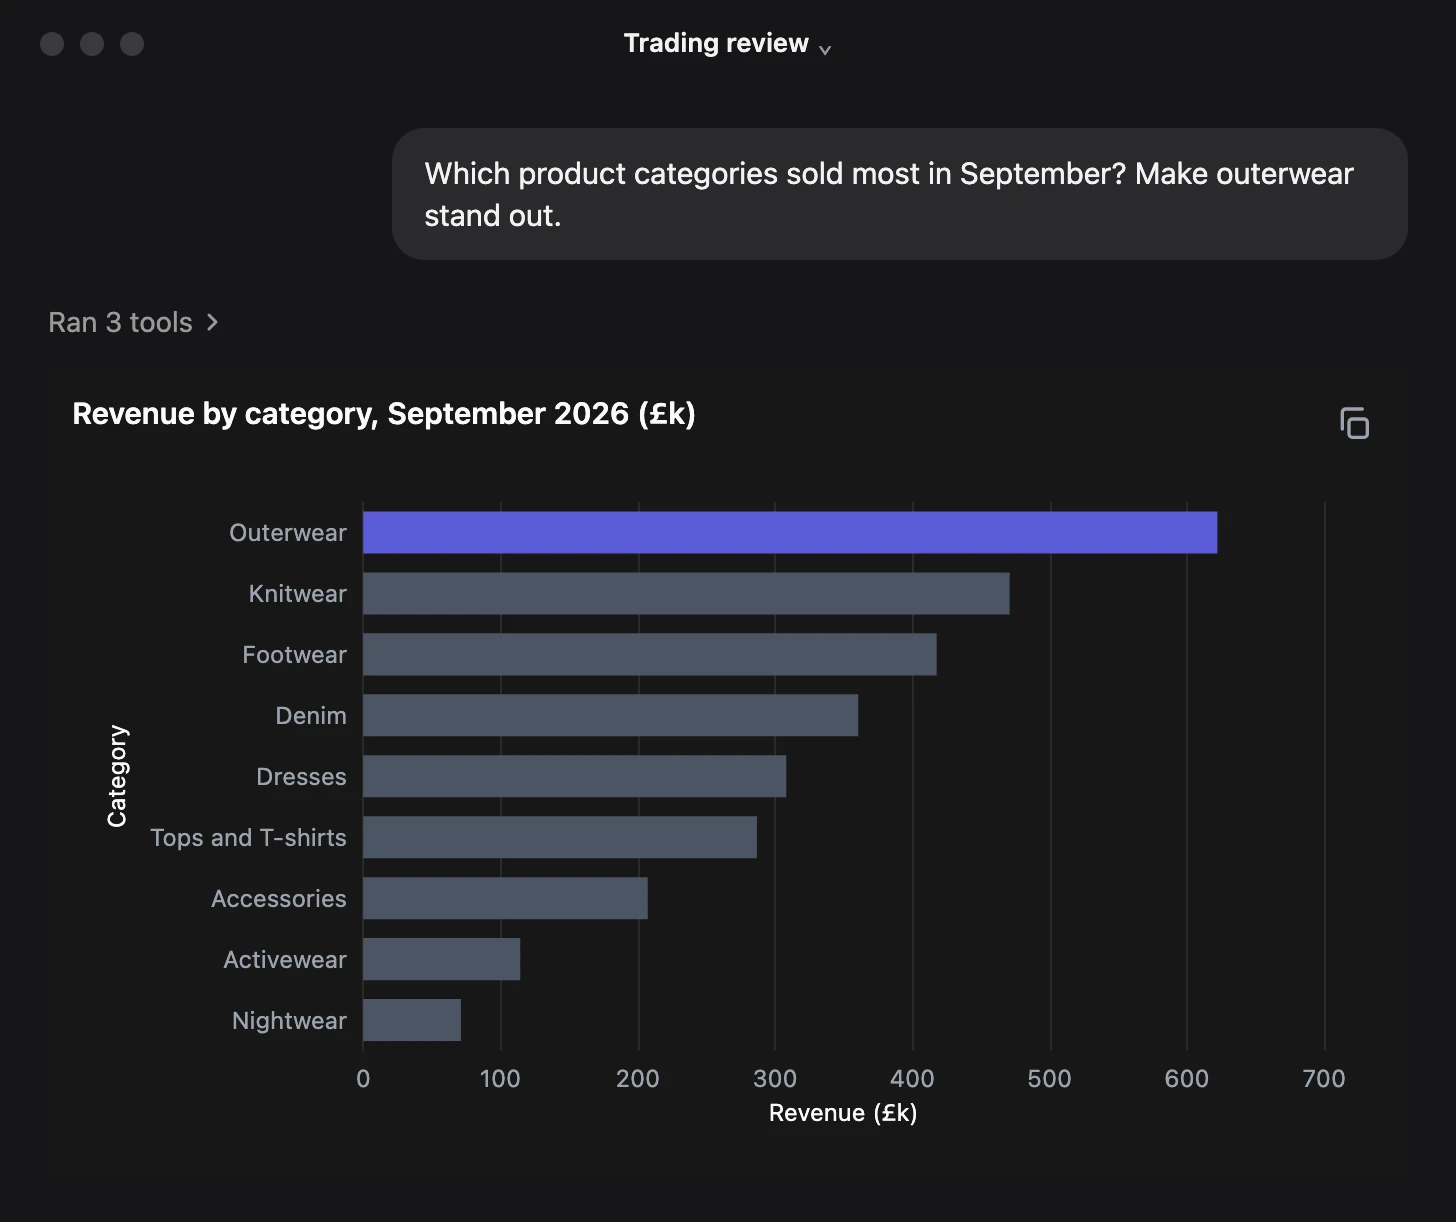
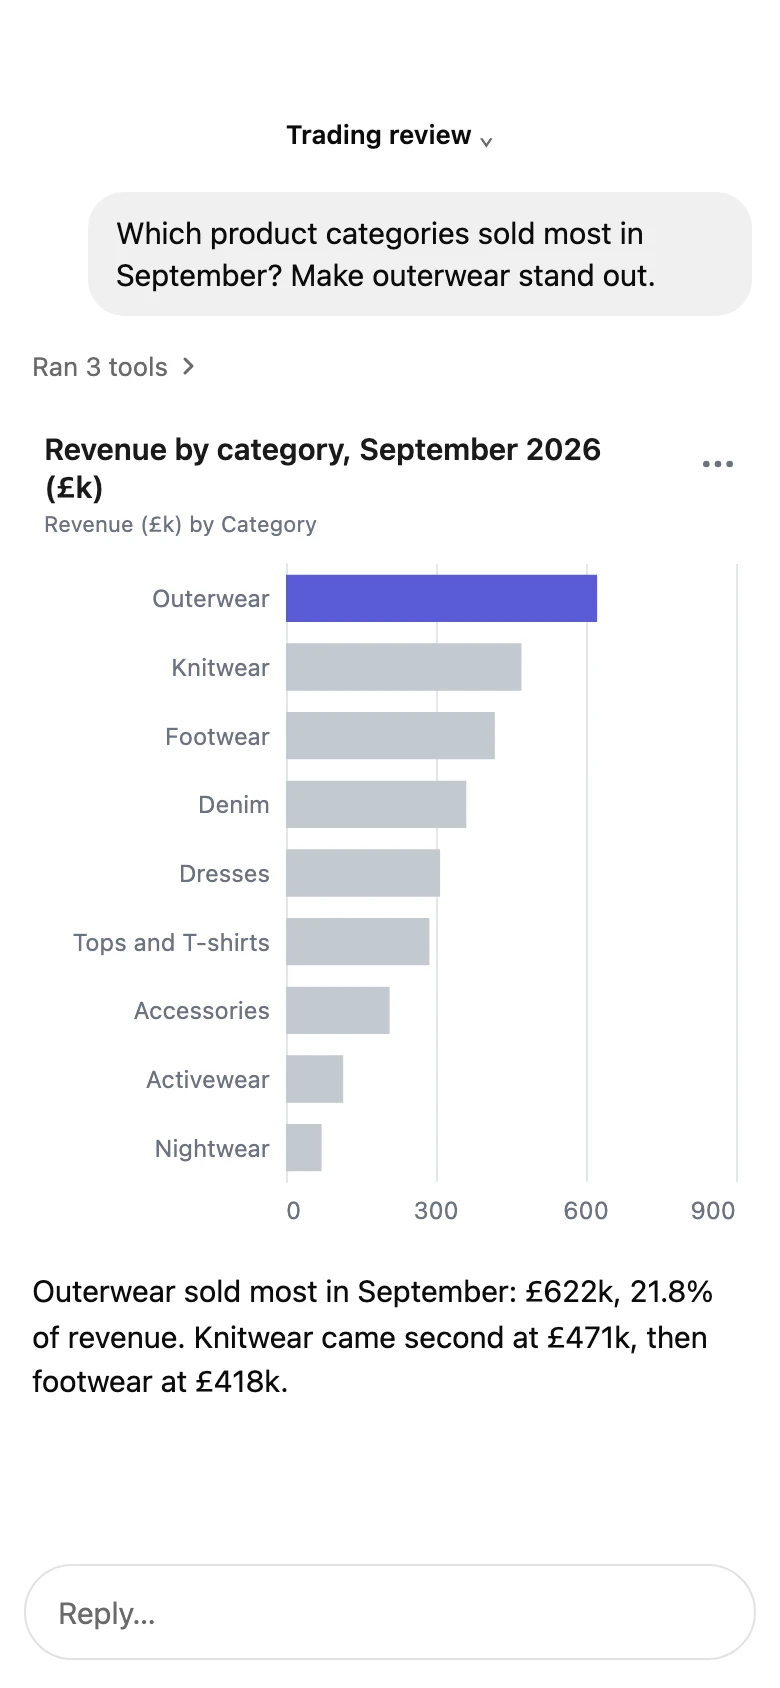
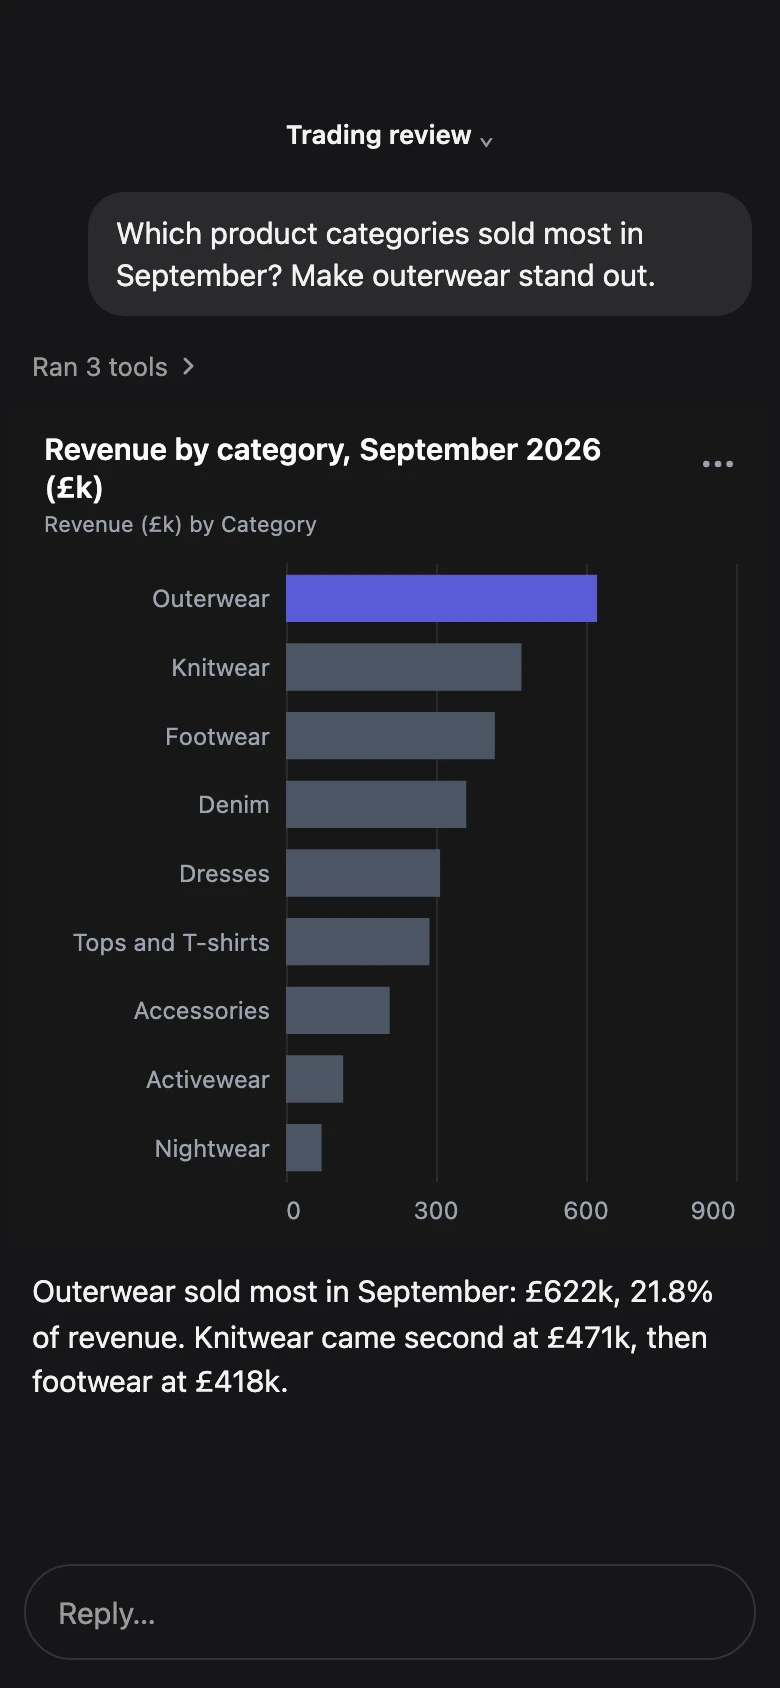
Highlights. Up to three series in colour.
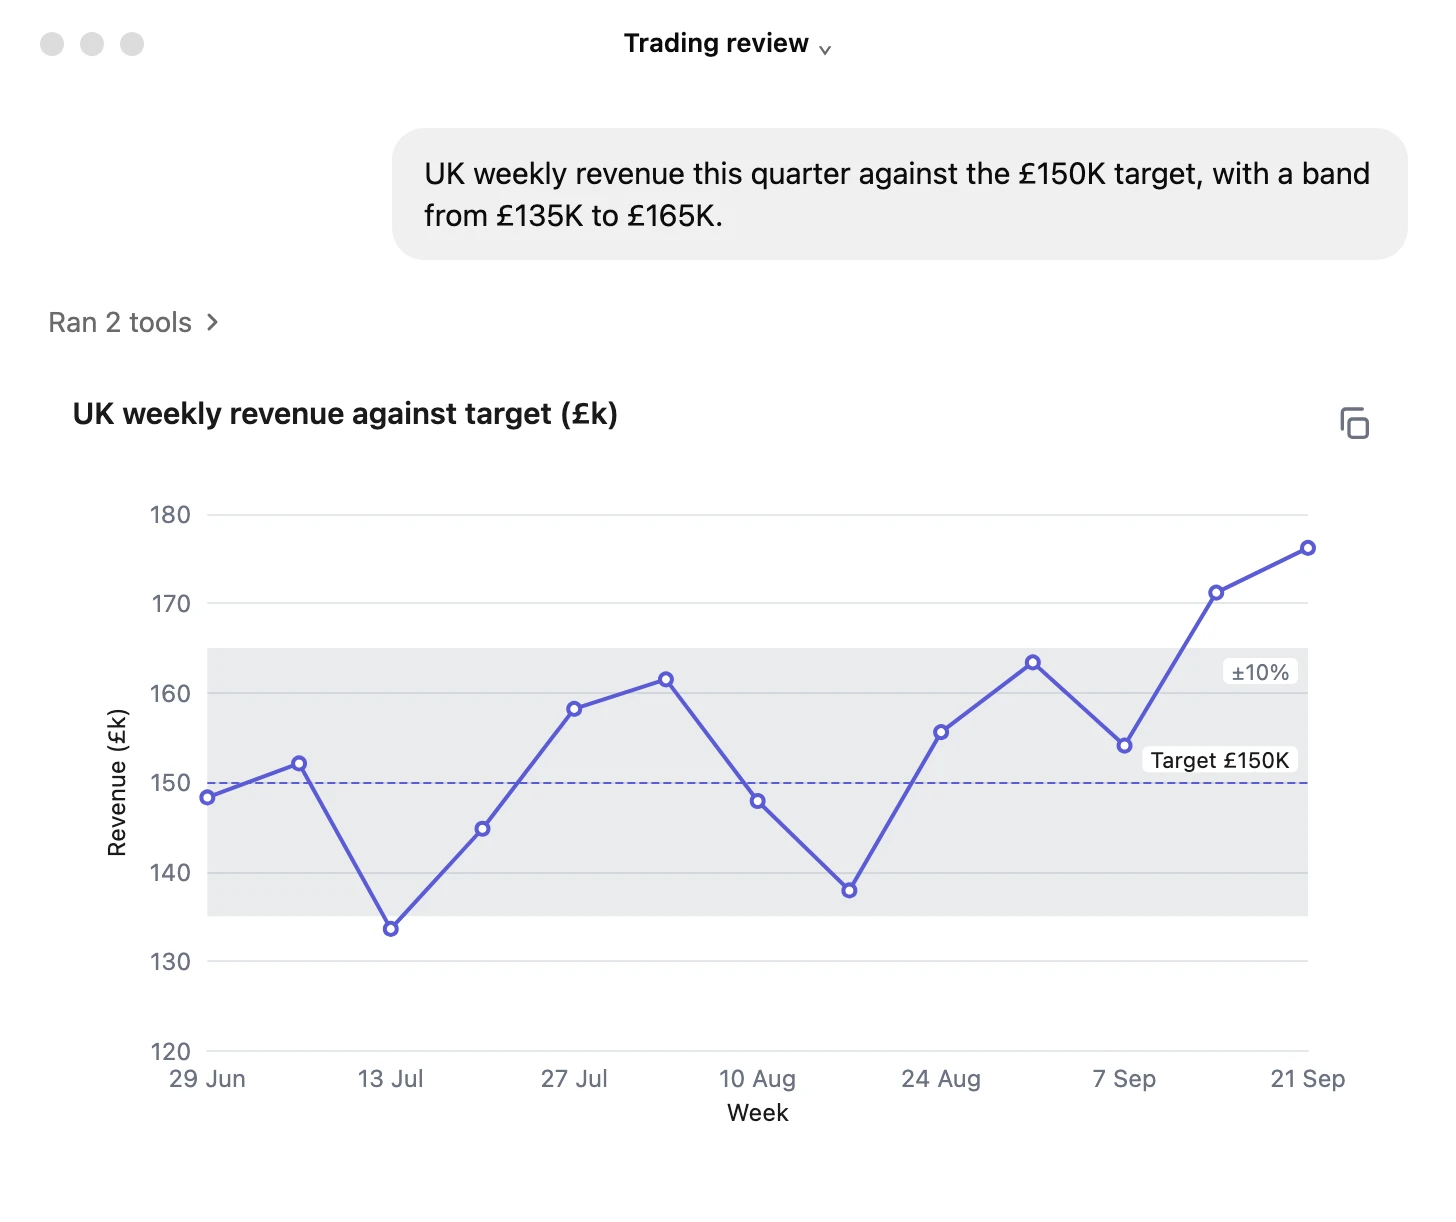
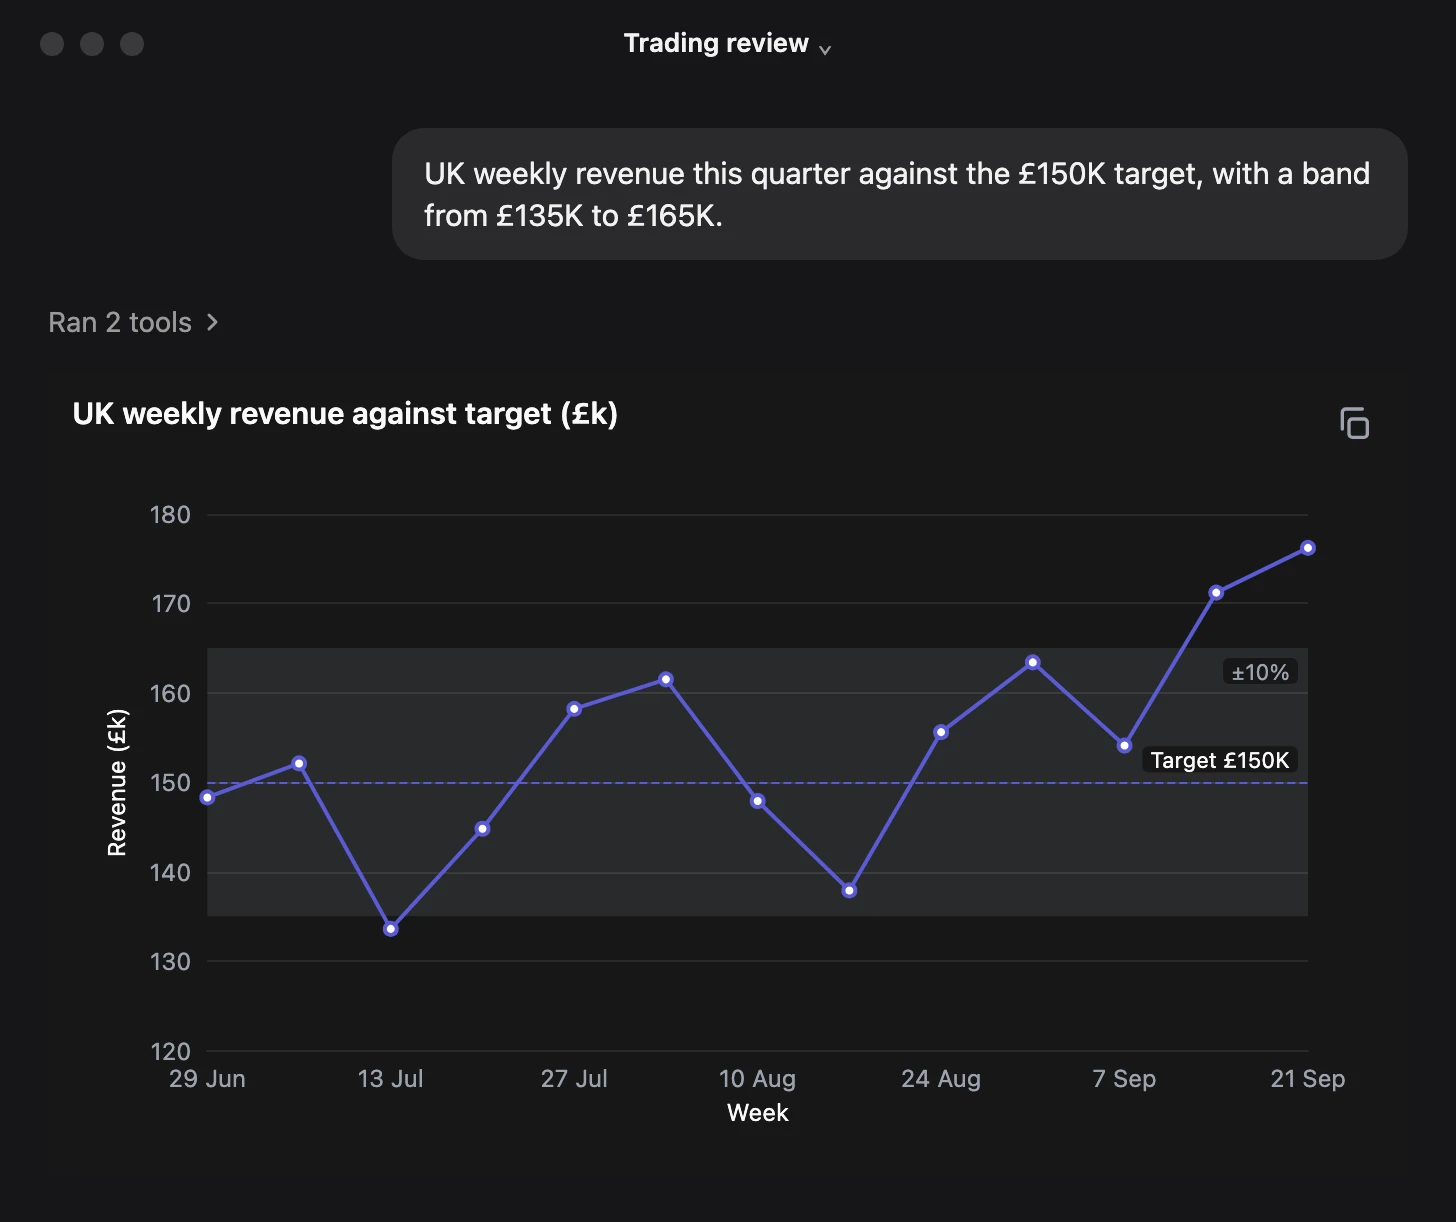
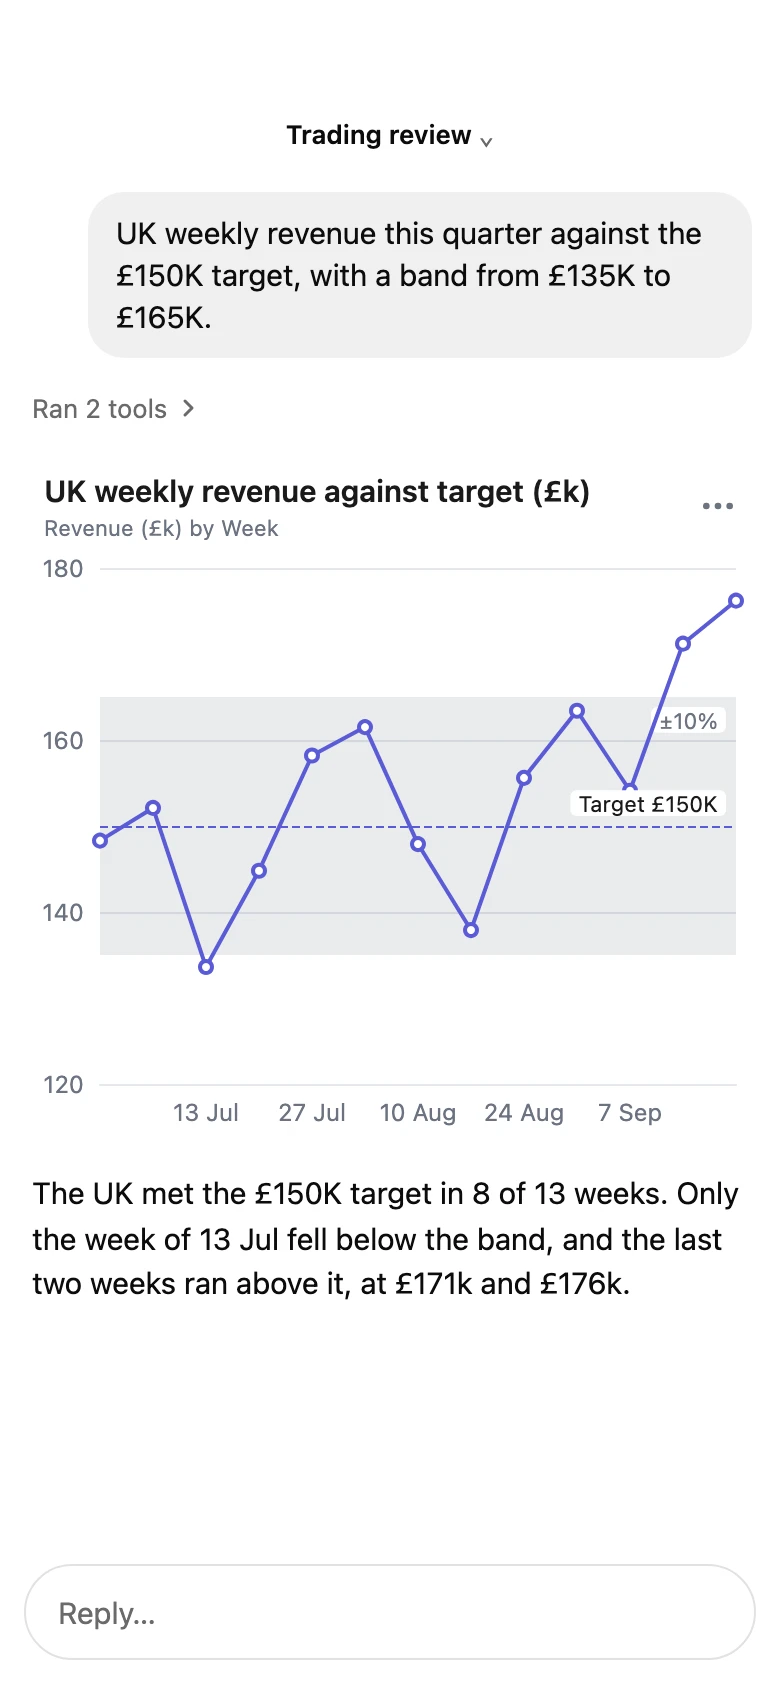
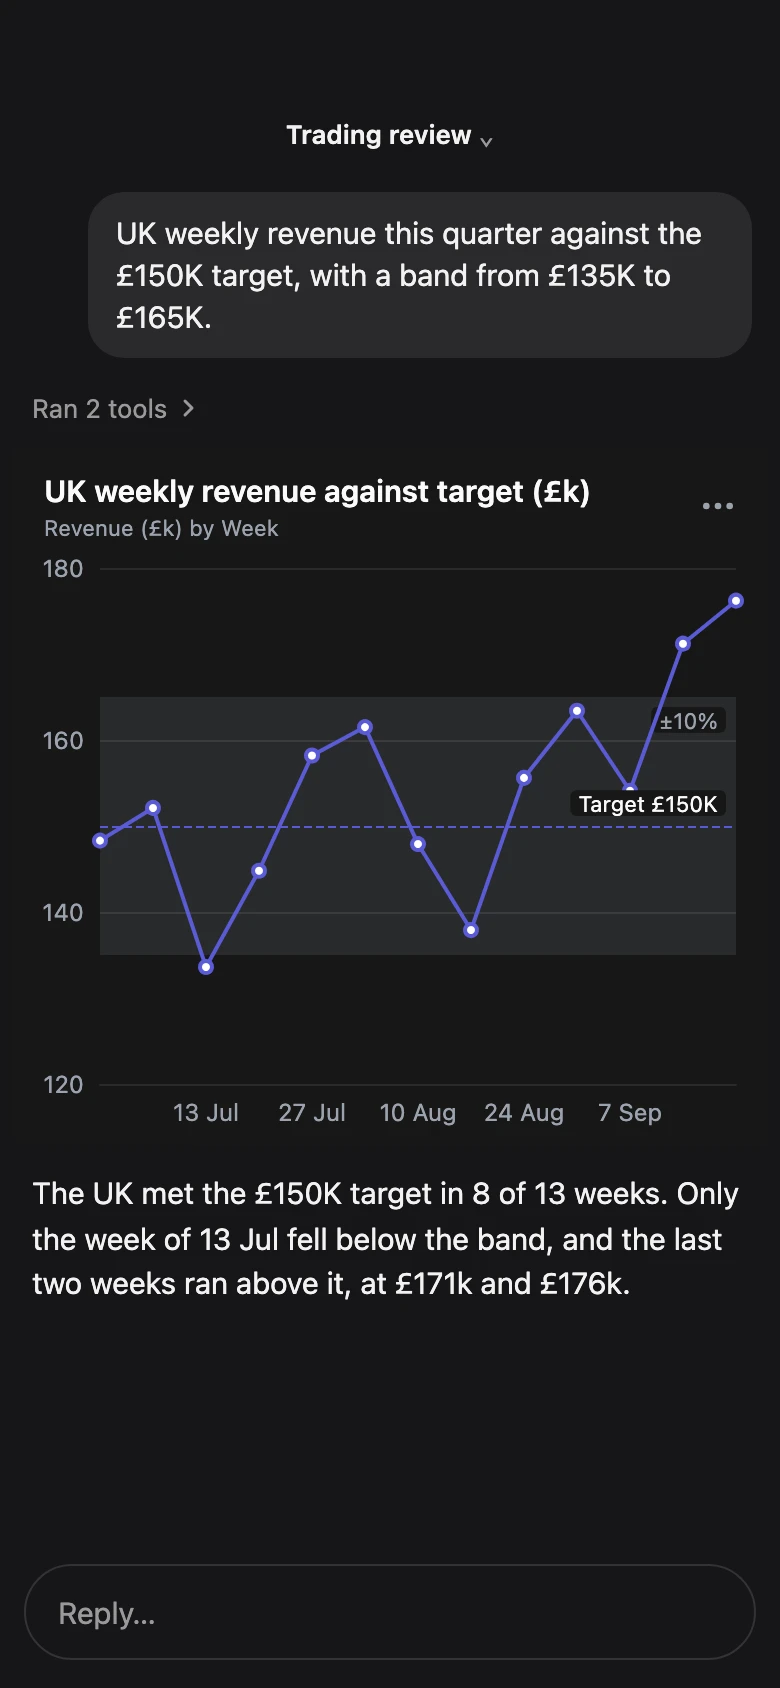
Targets and bands. Targets, bands, averages, medians.
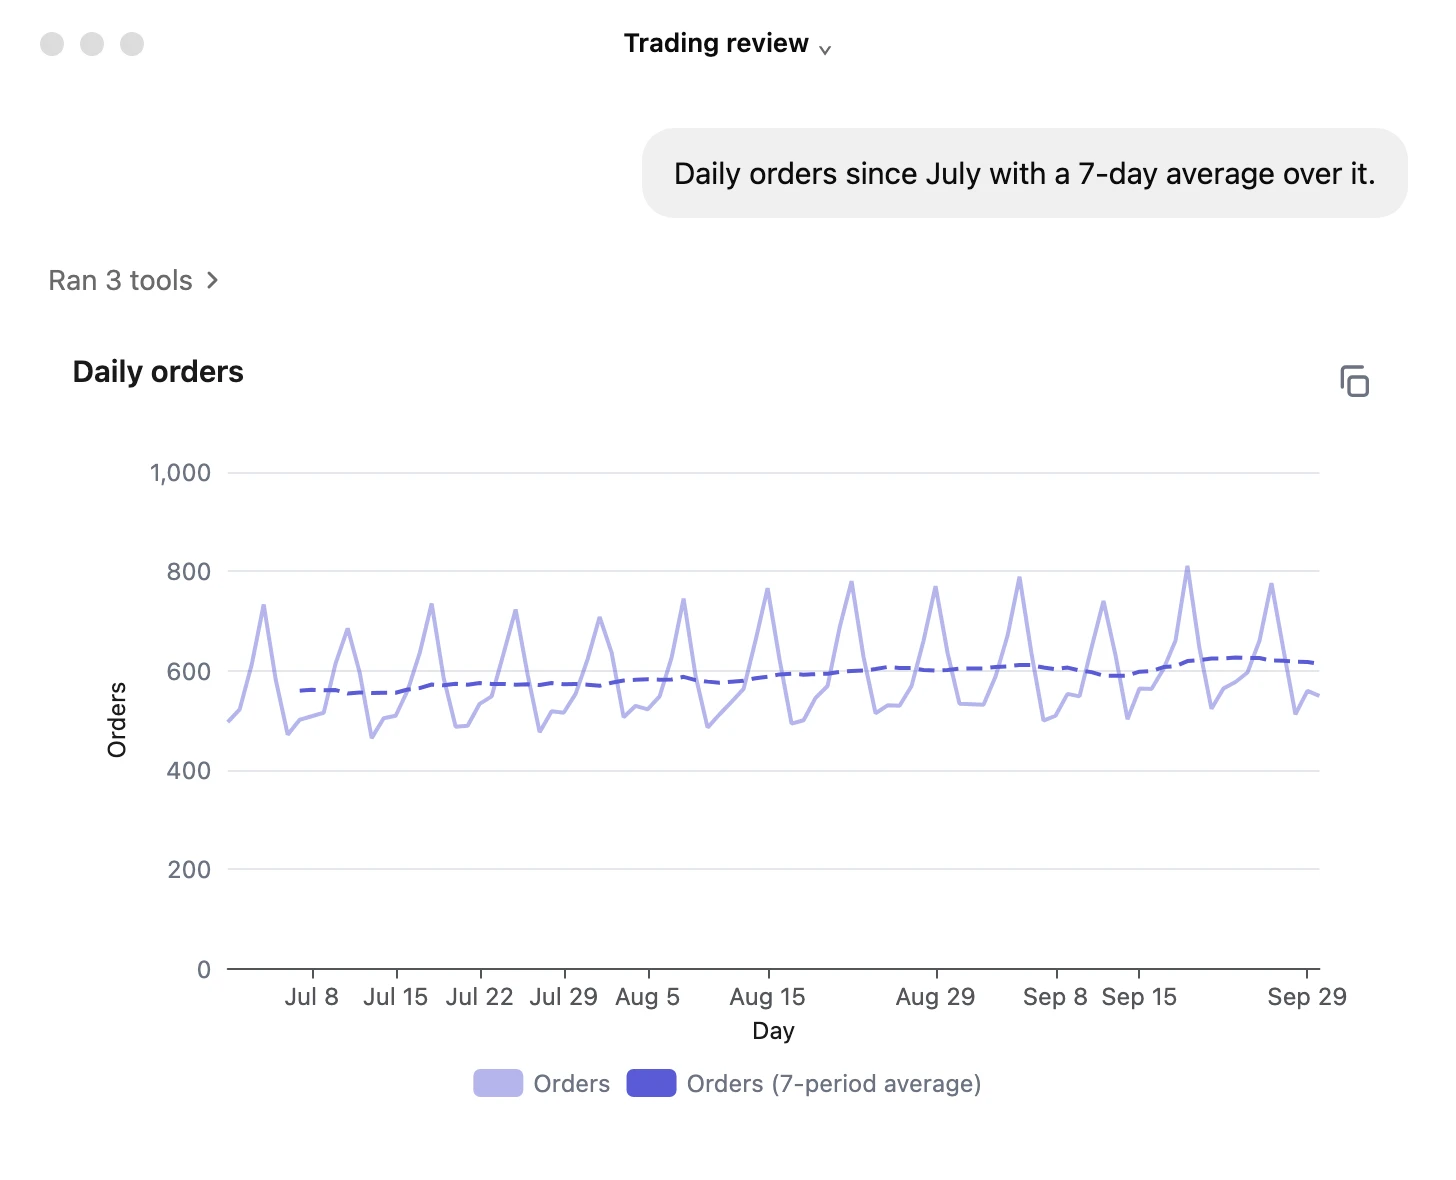
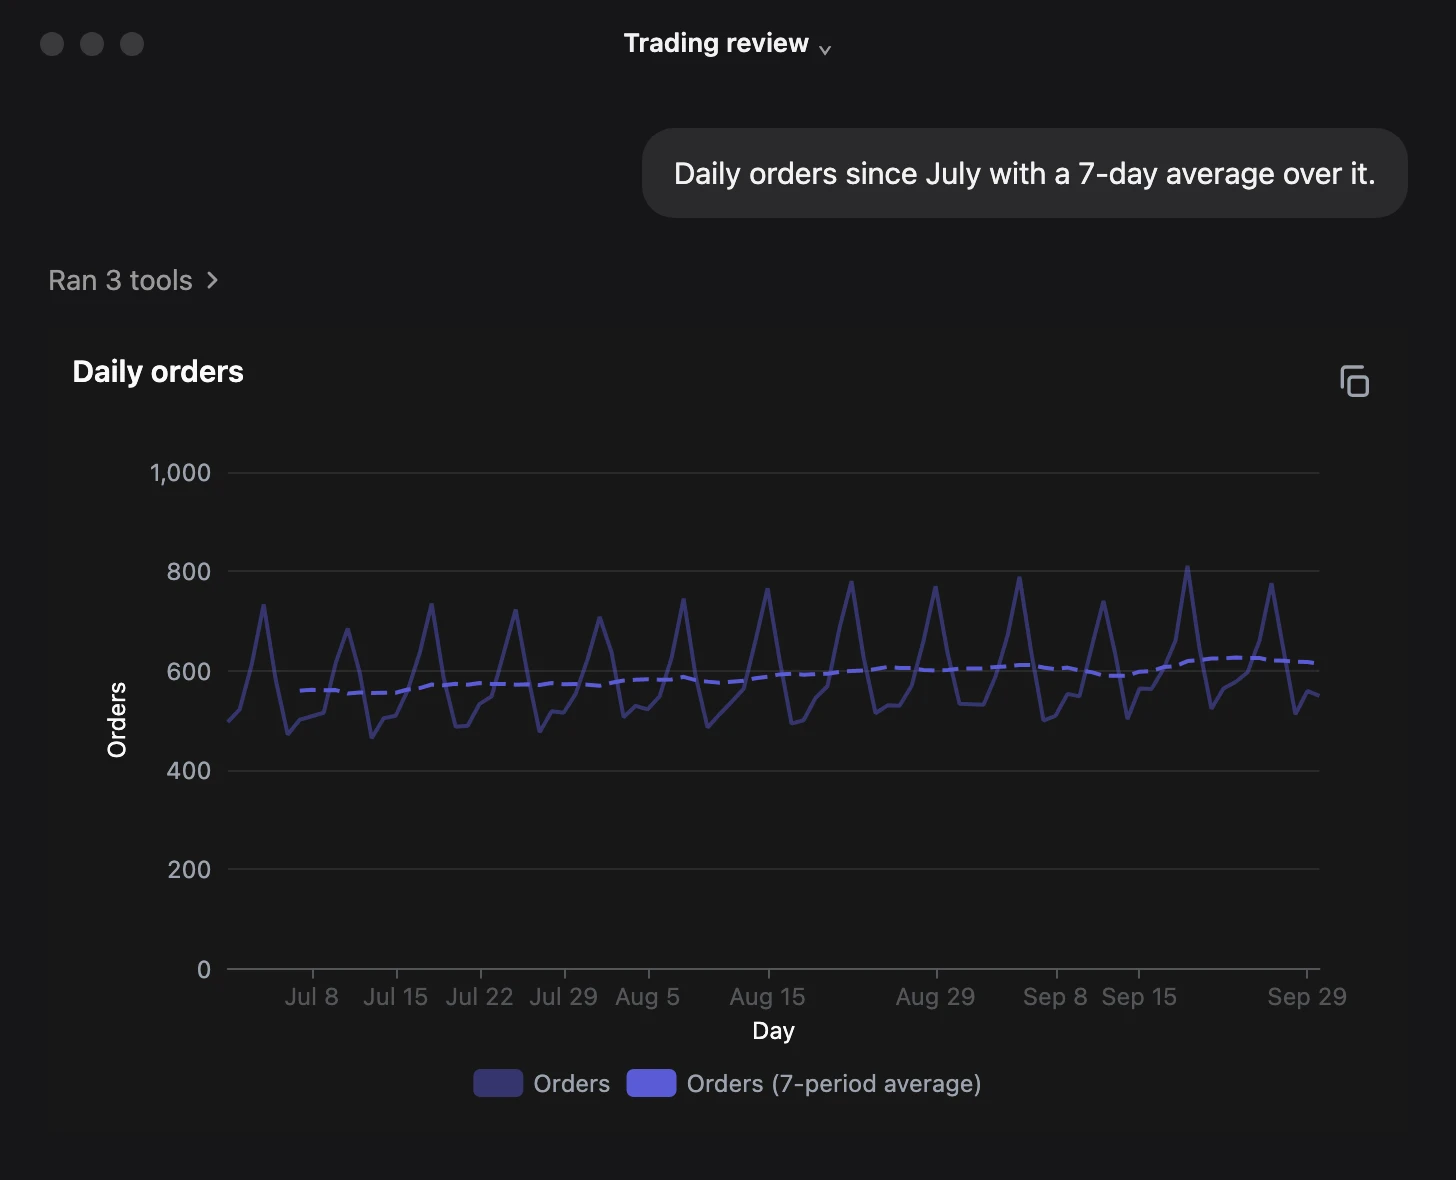
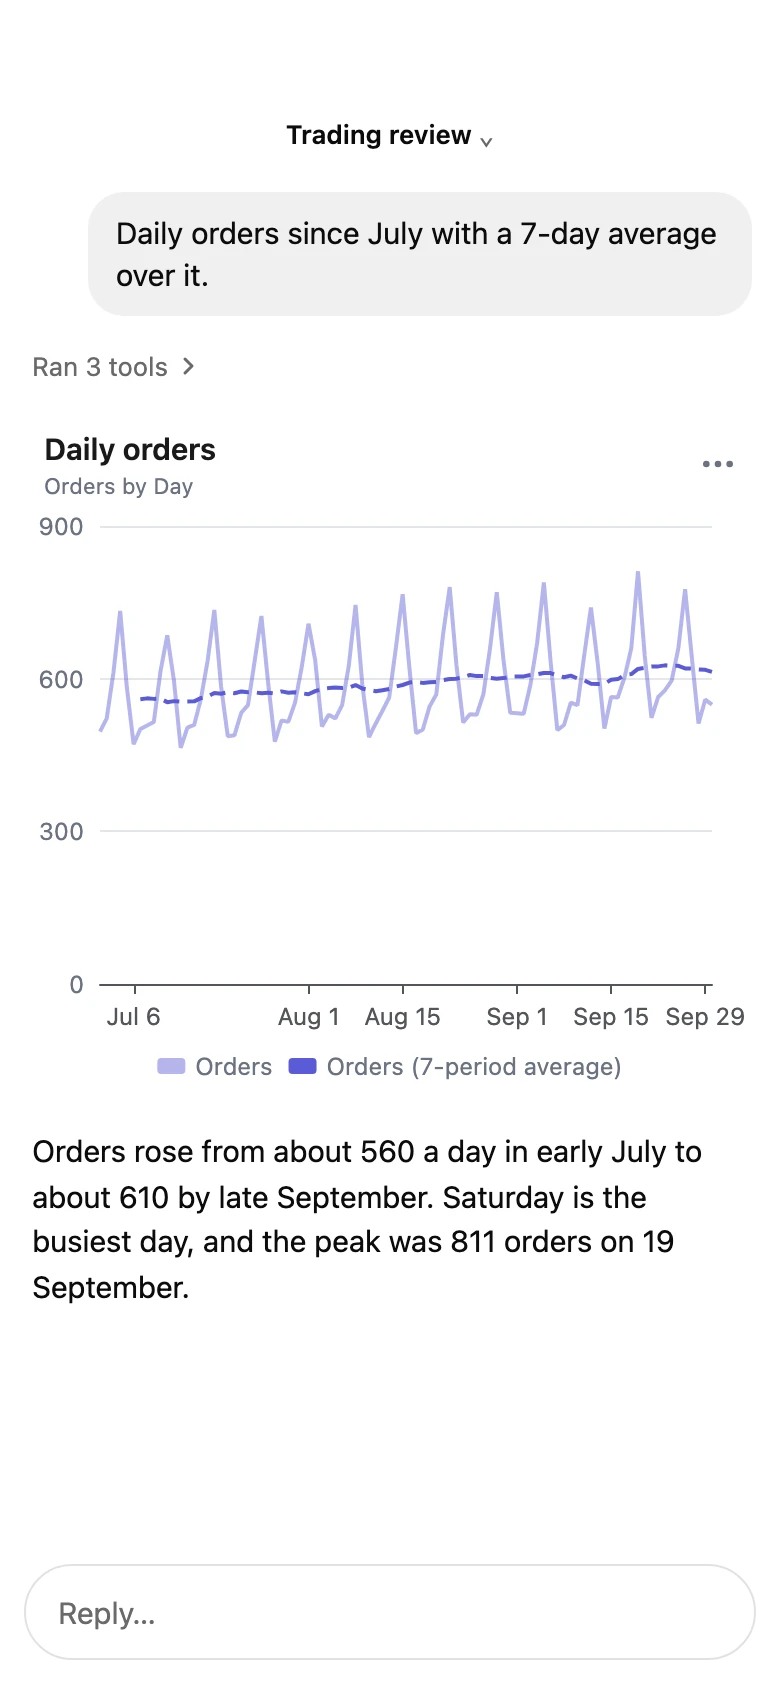
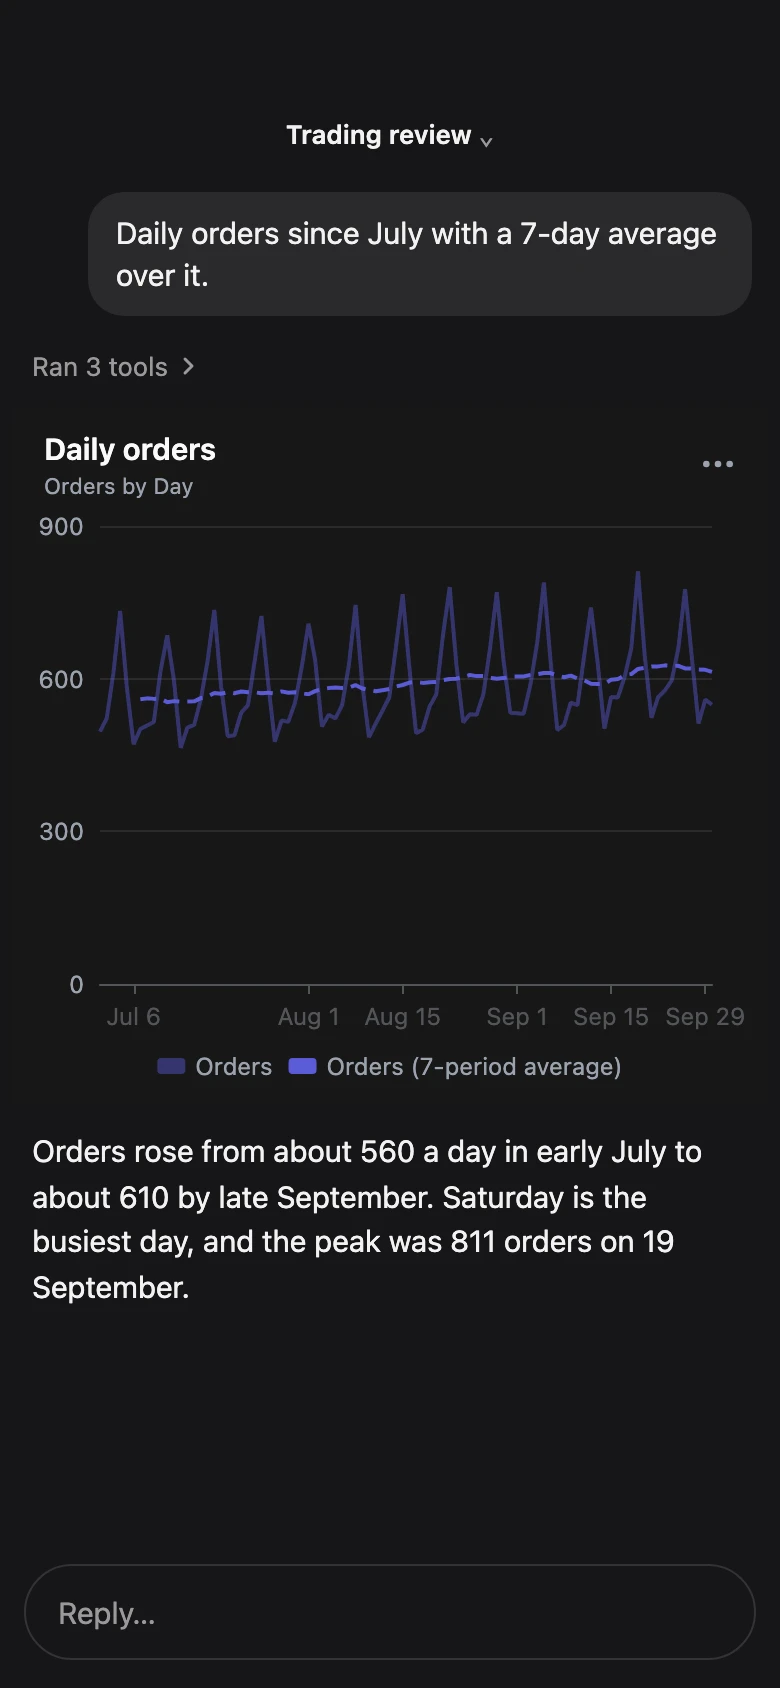
Trends. Trend lines and moving averages.
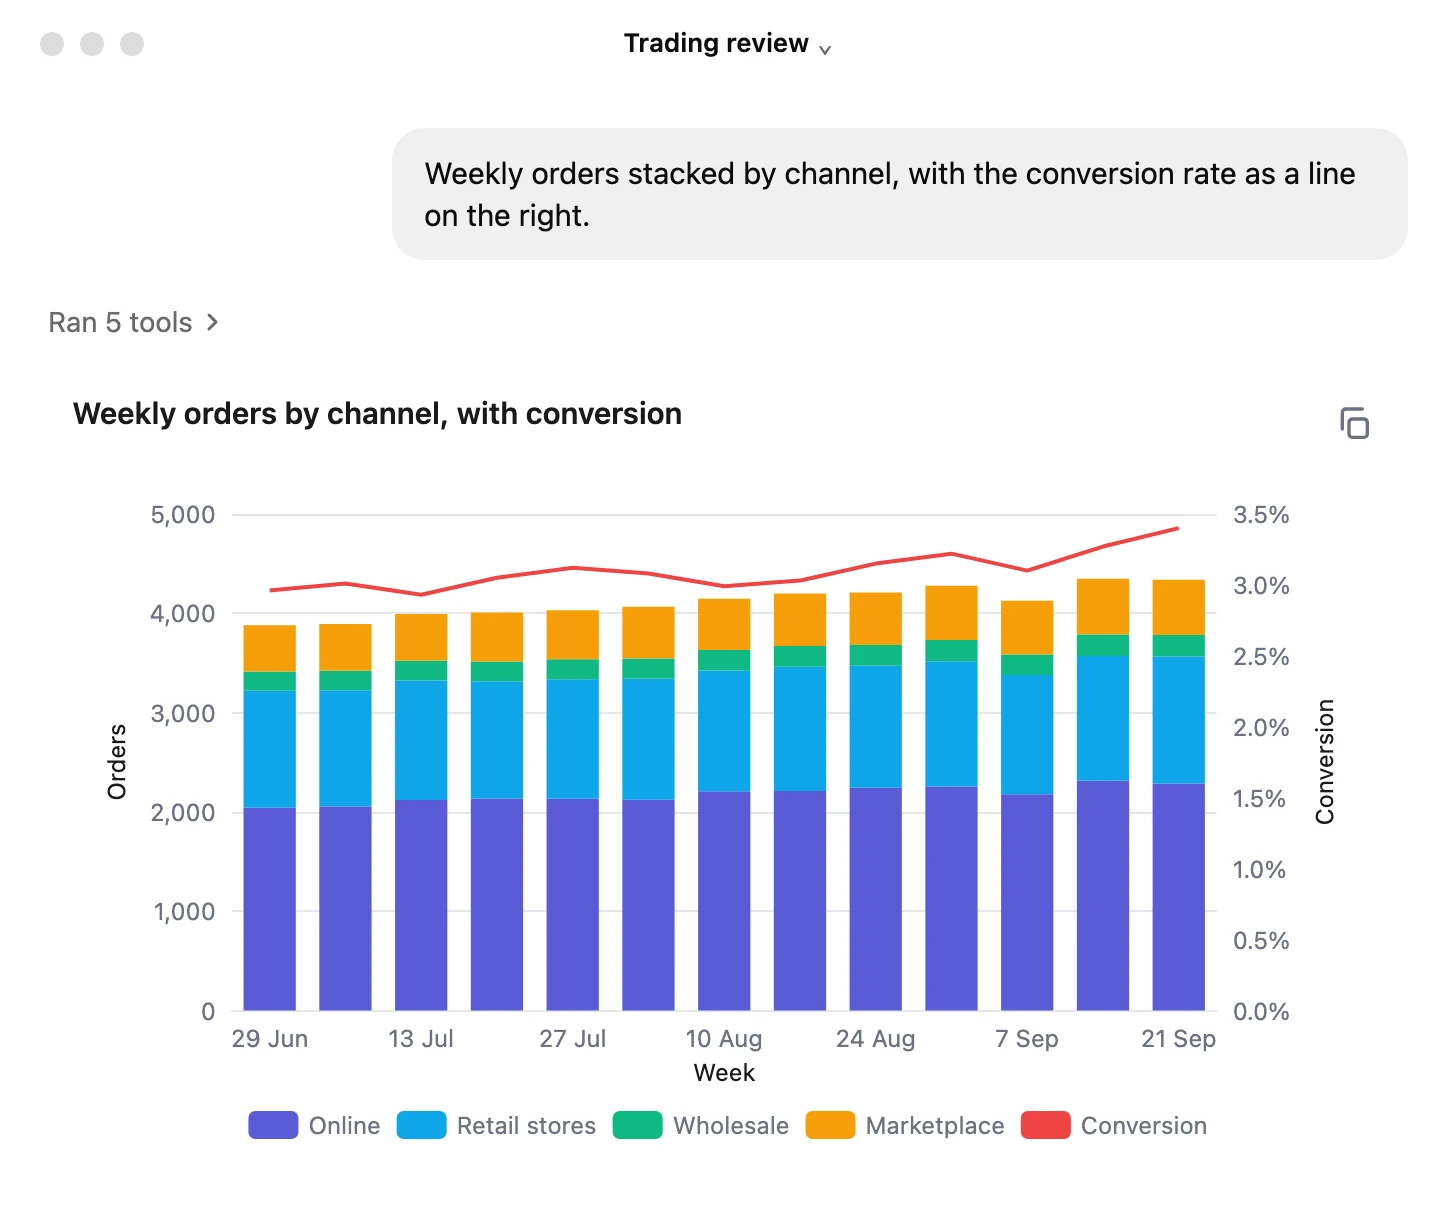
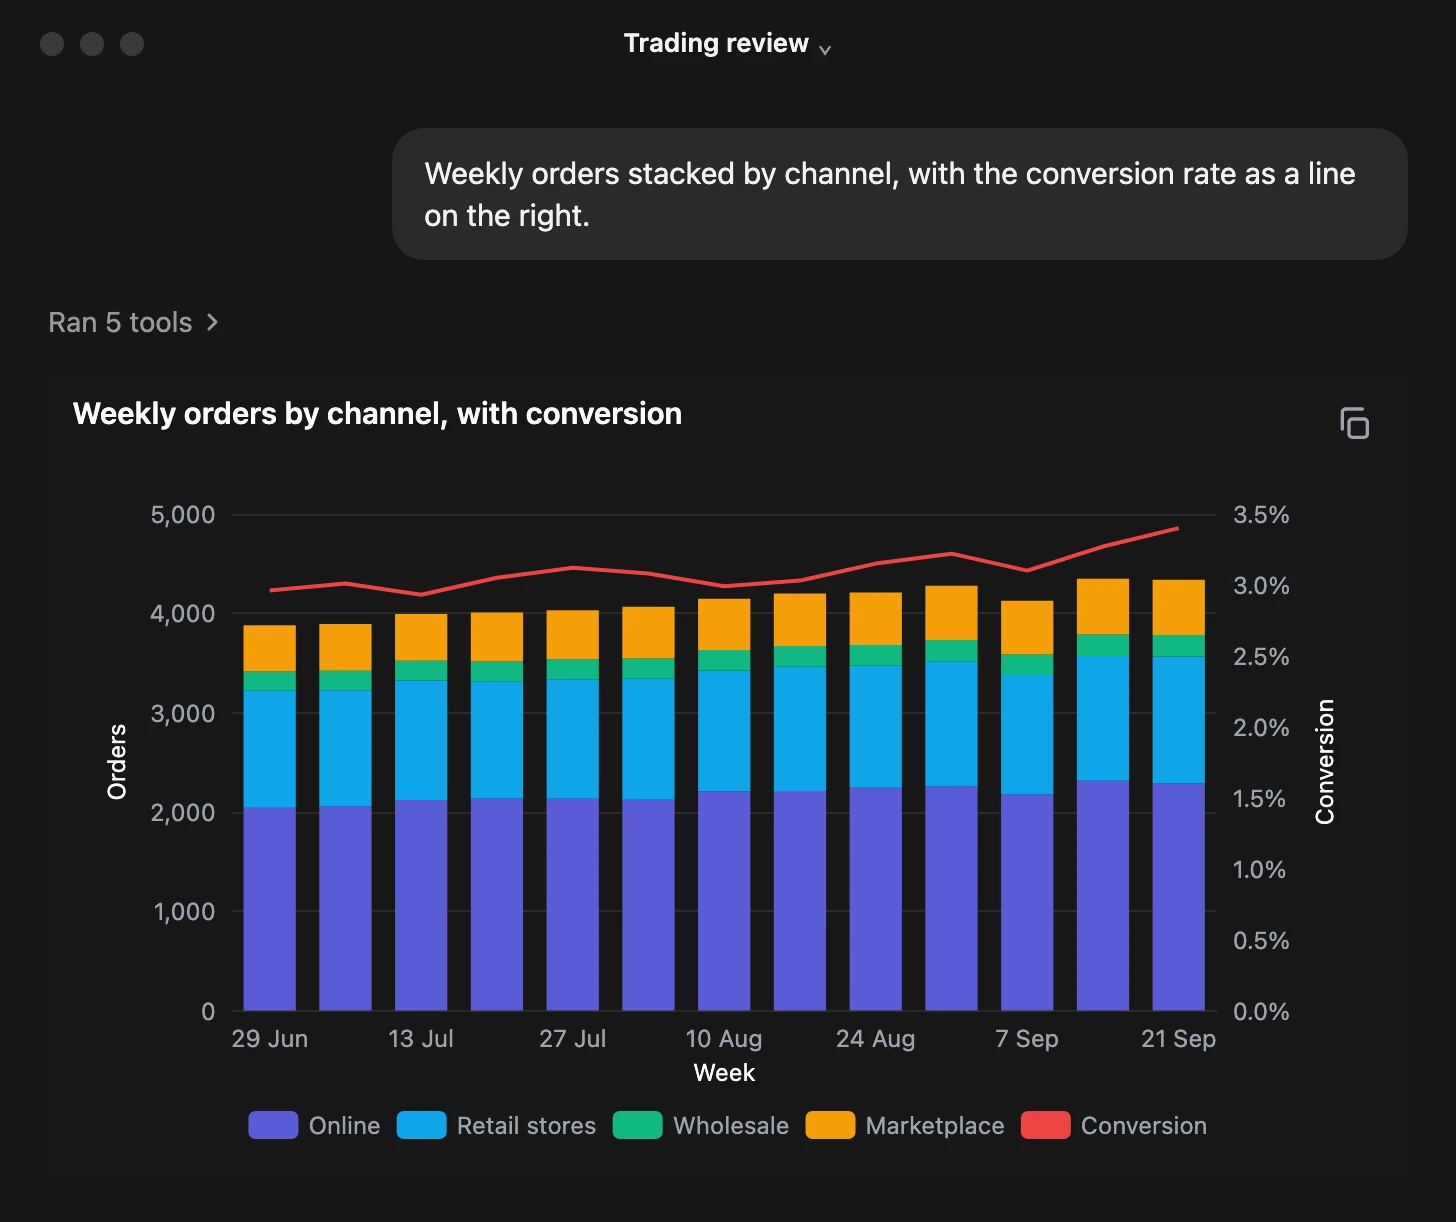
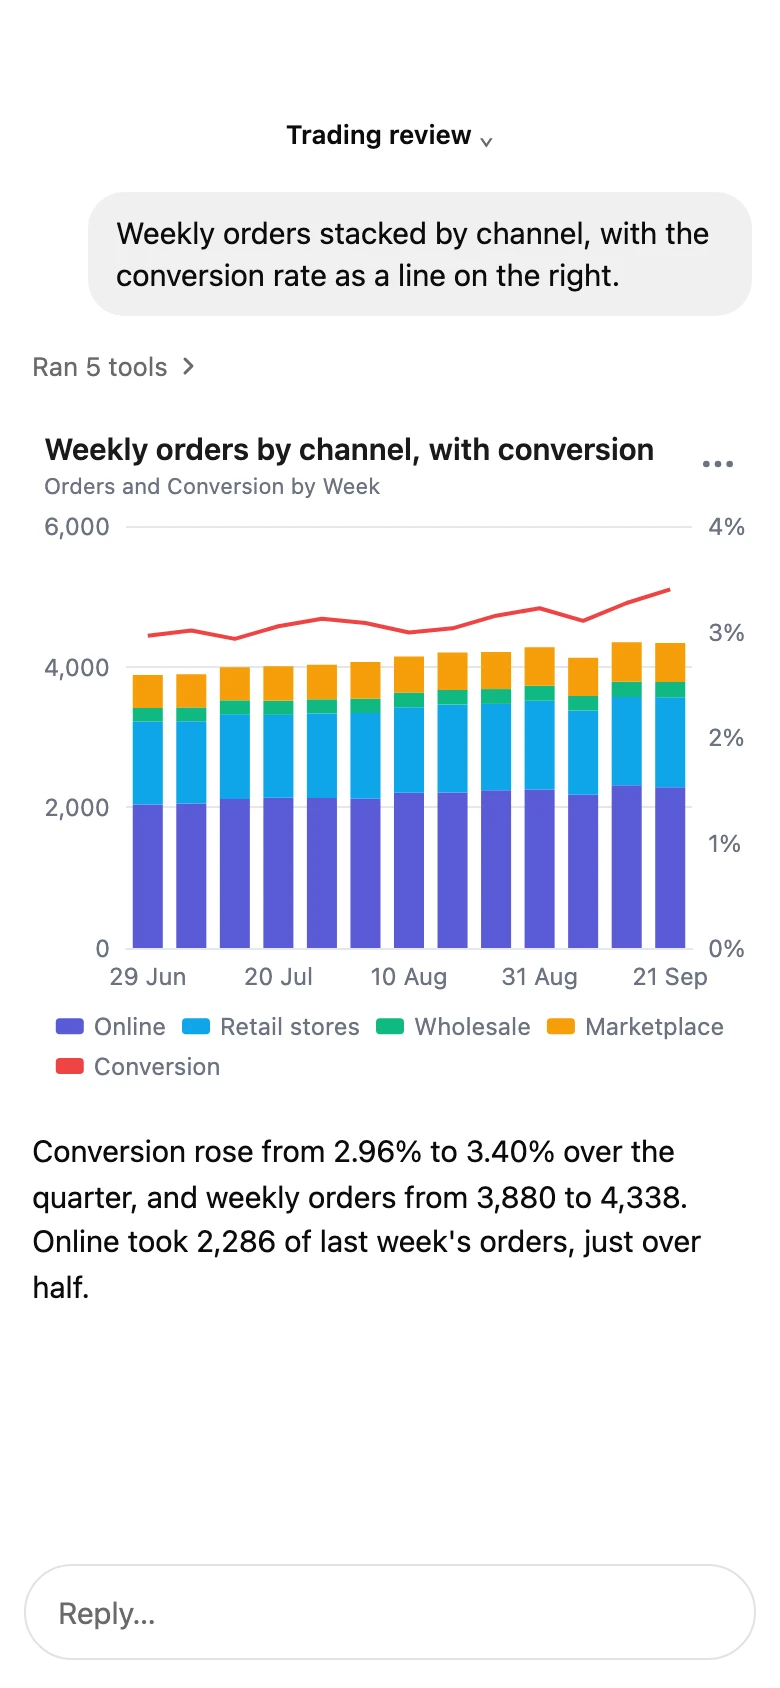
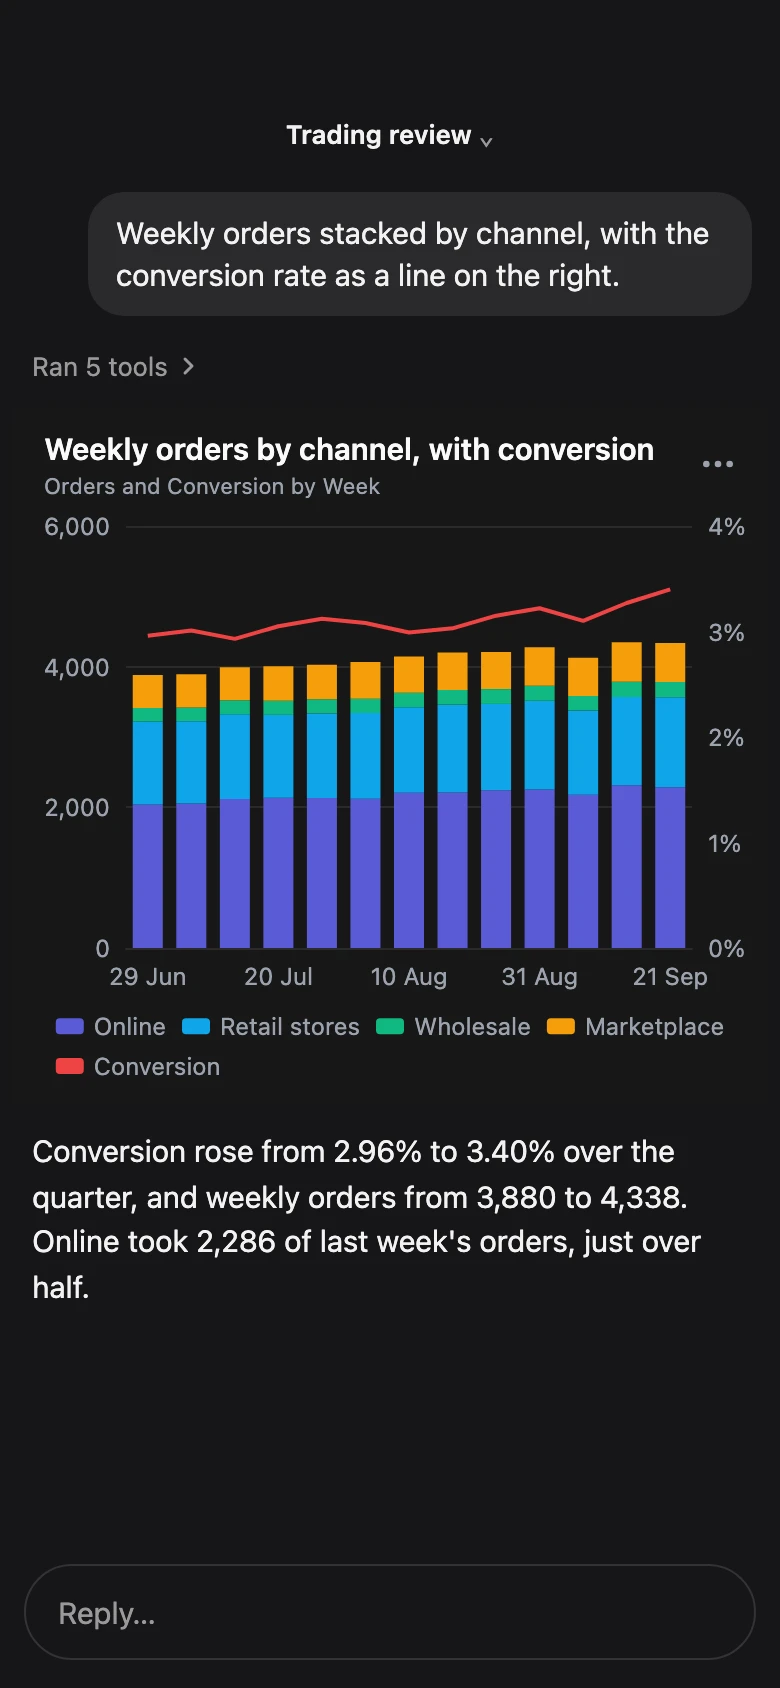
Bars with a rate. A rate on its own right-hand axis.
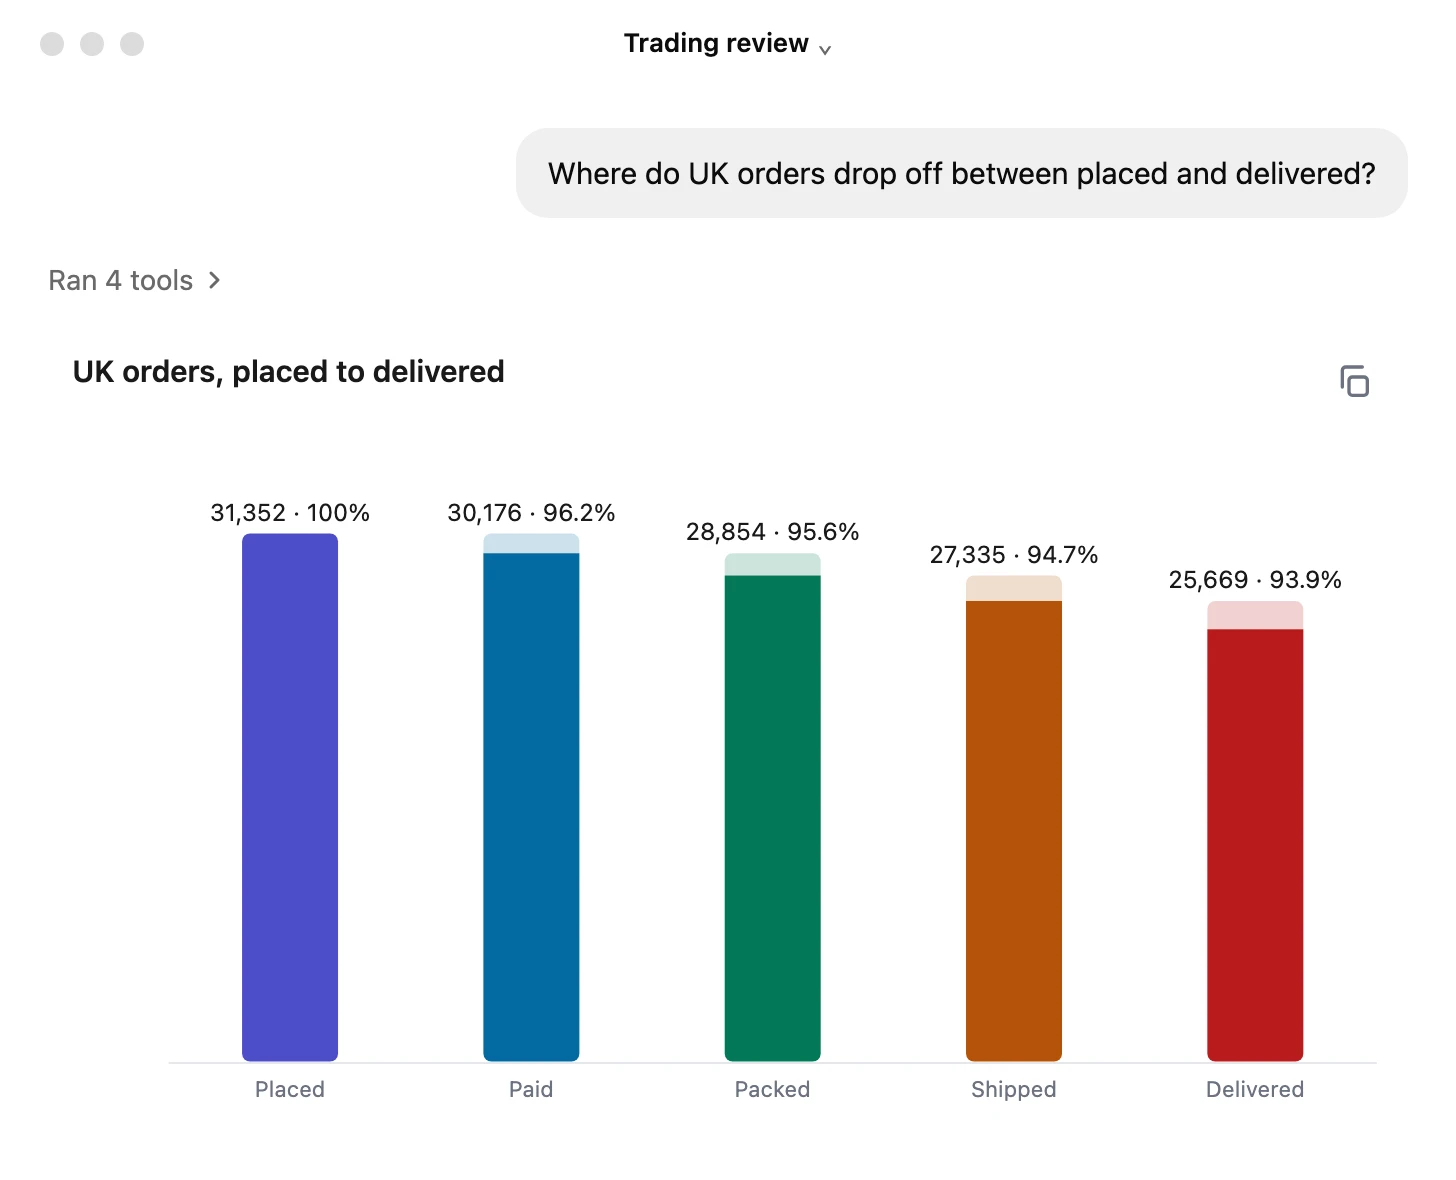
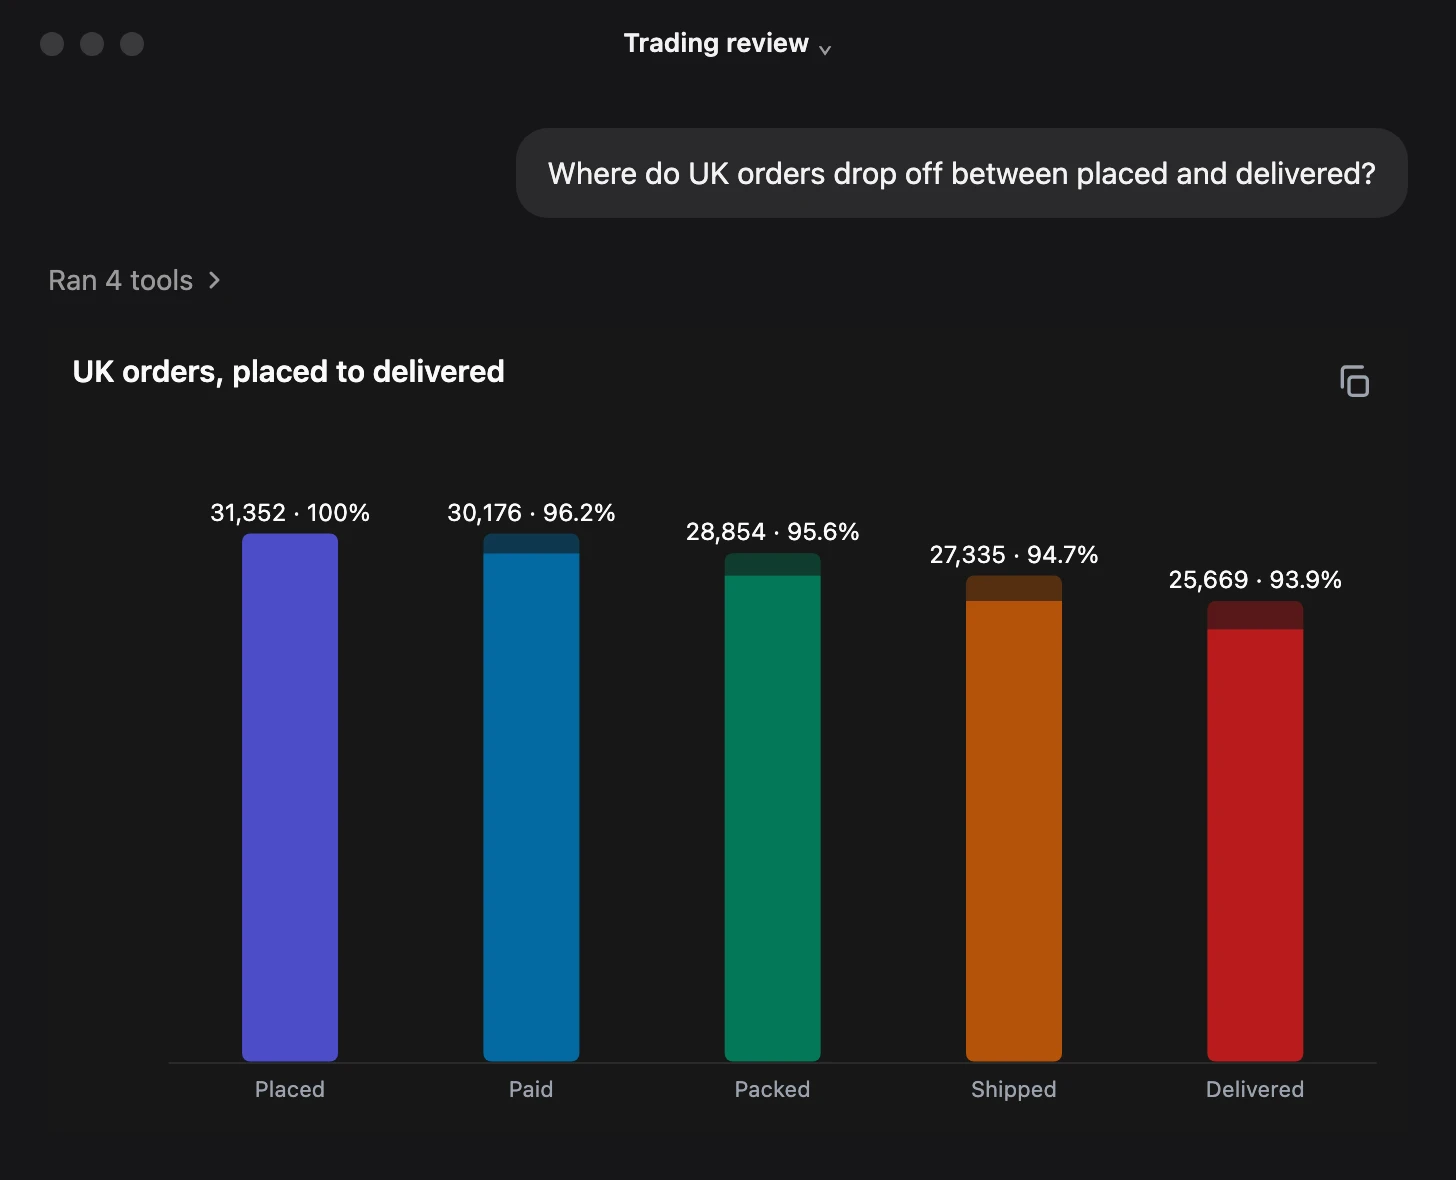
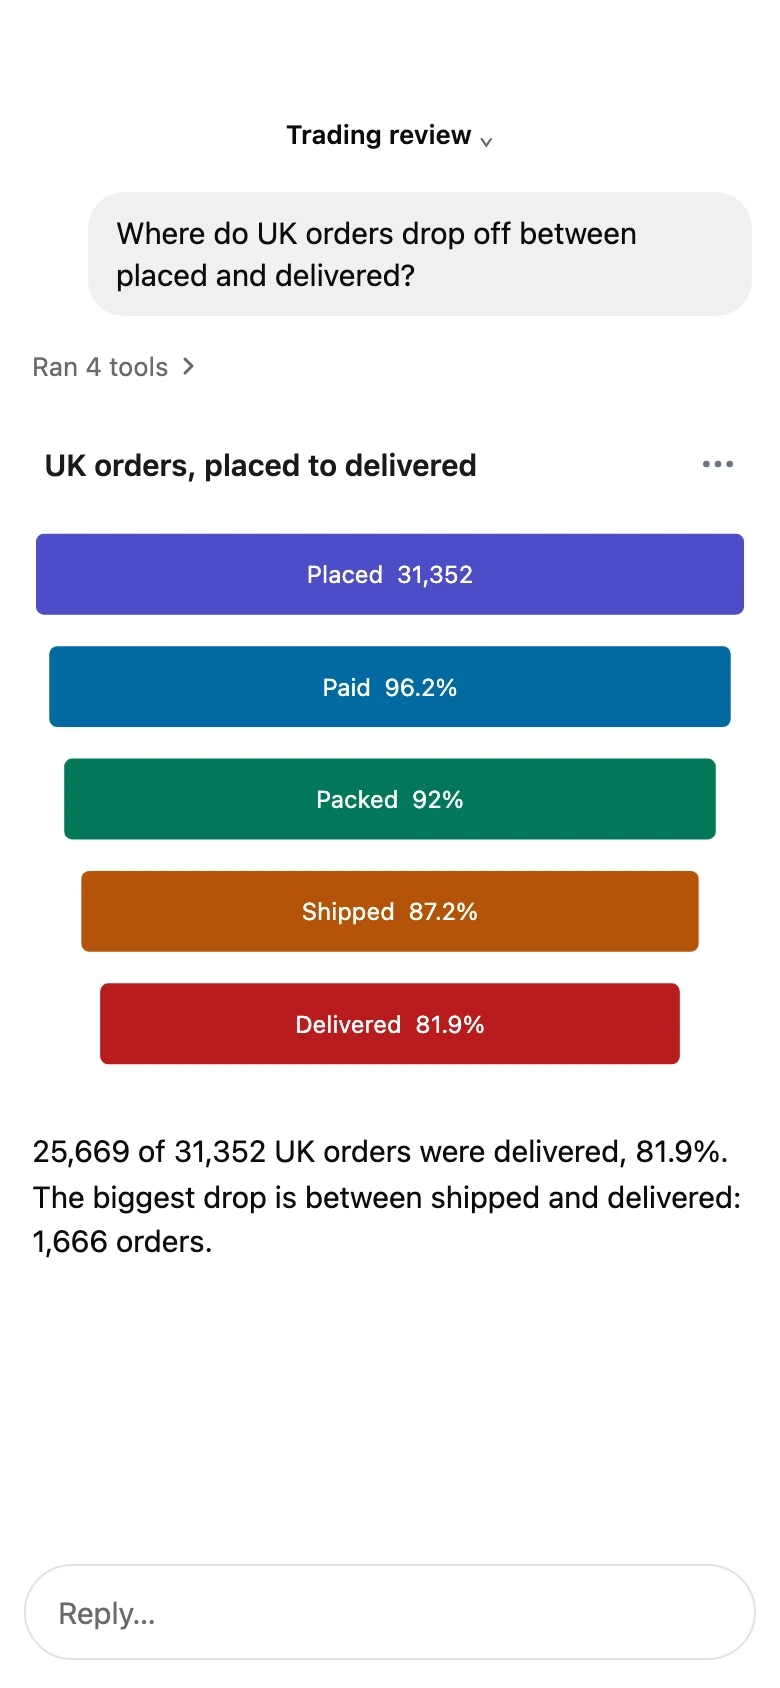
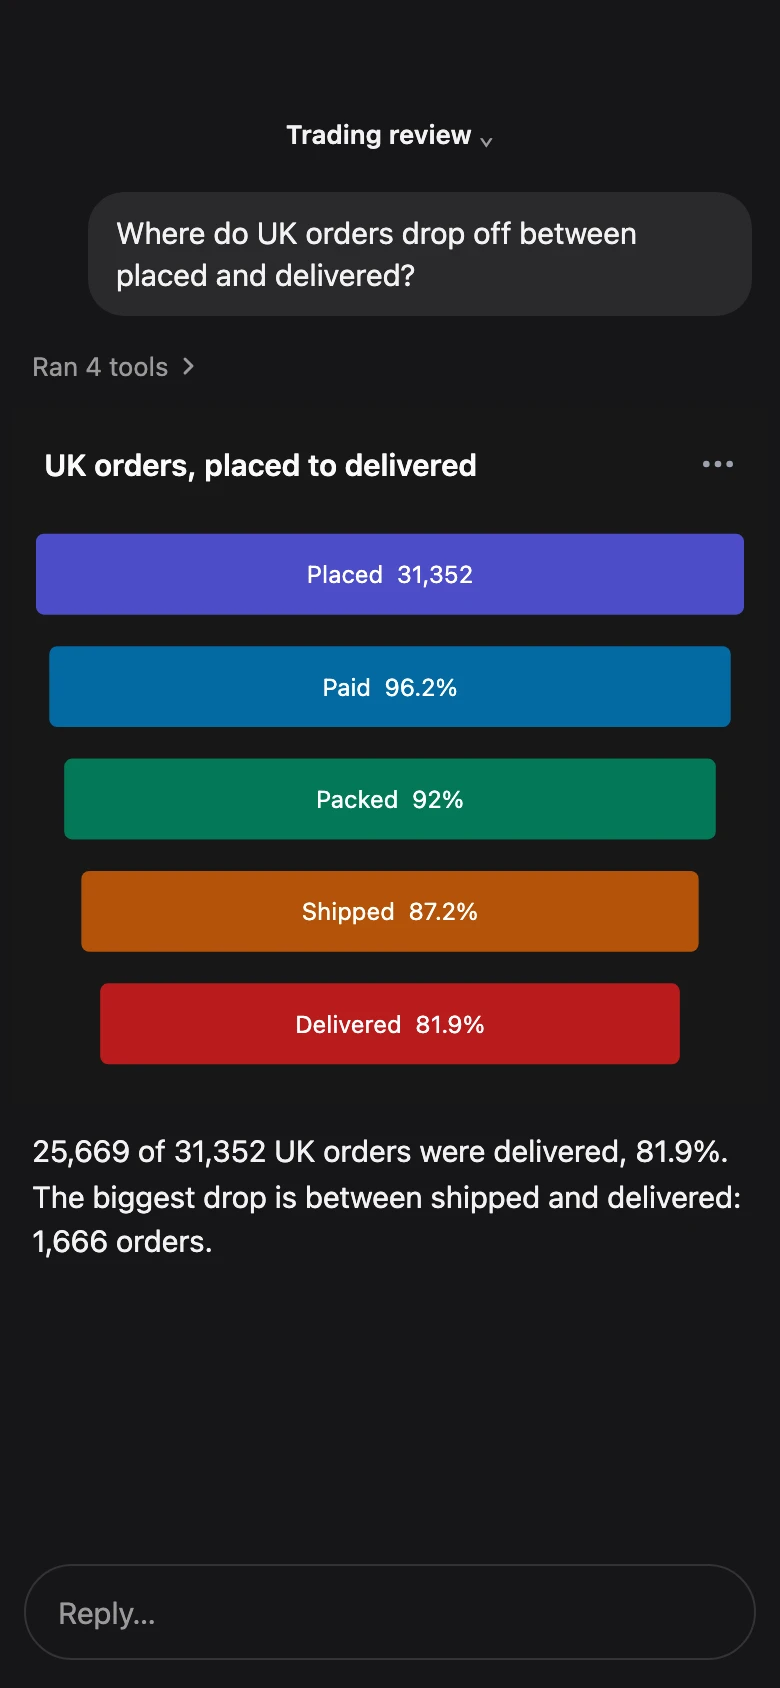
Funnels. Where orders or signups drop off.
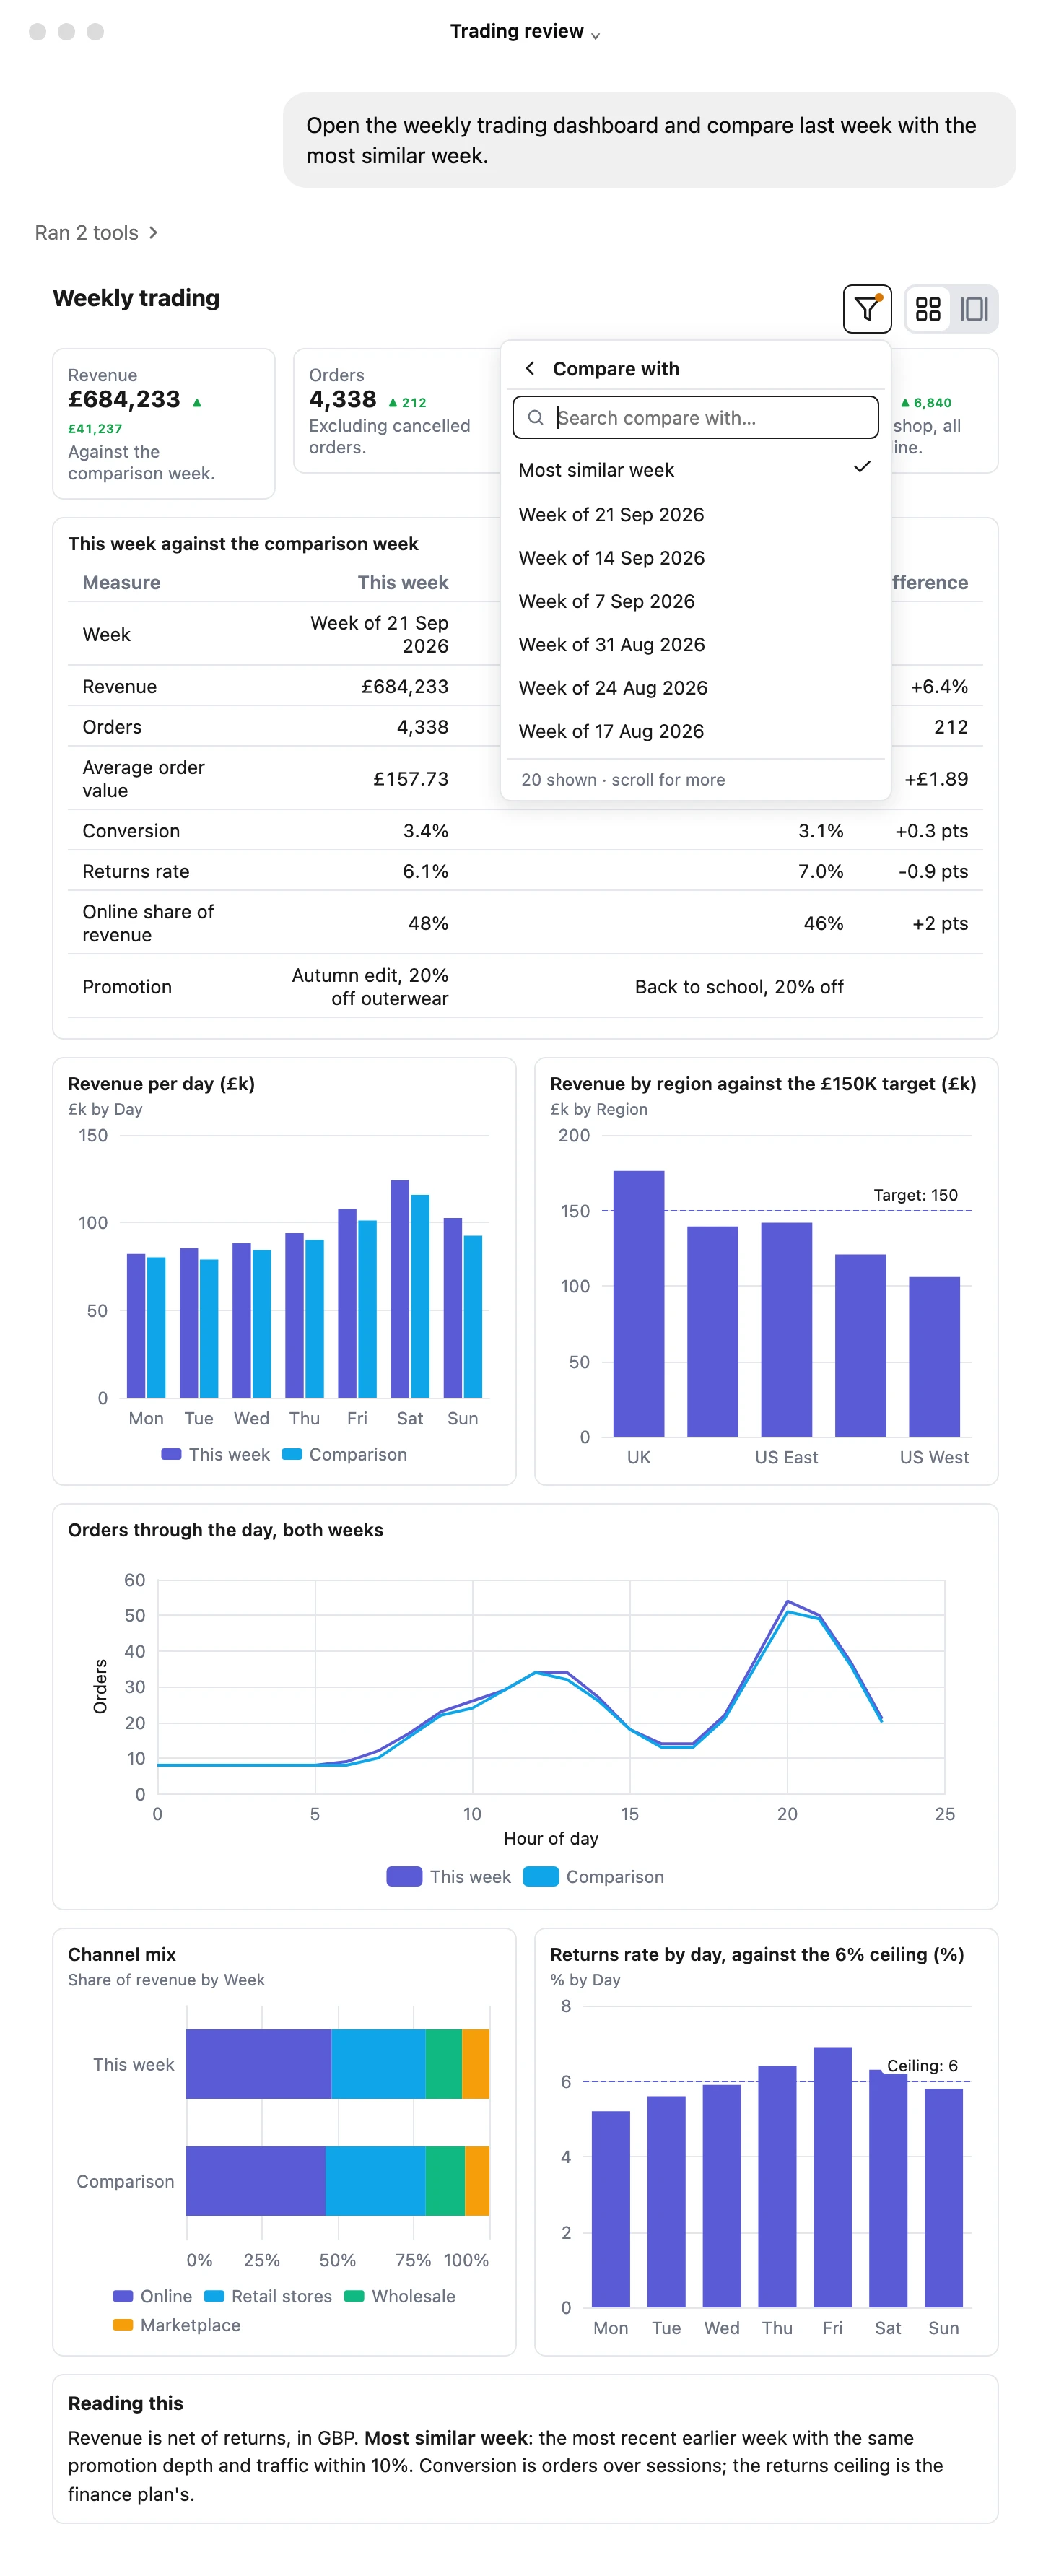
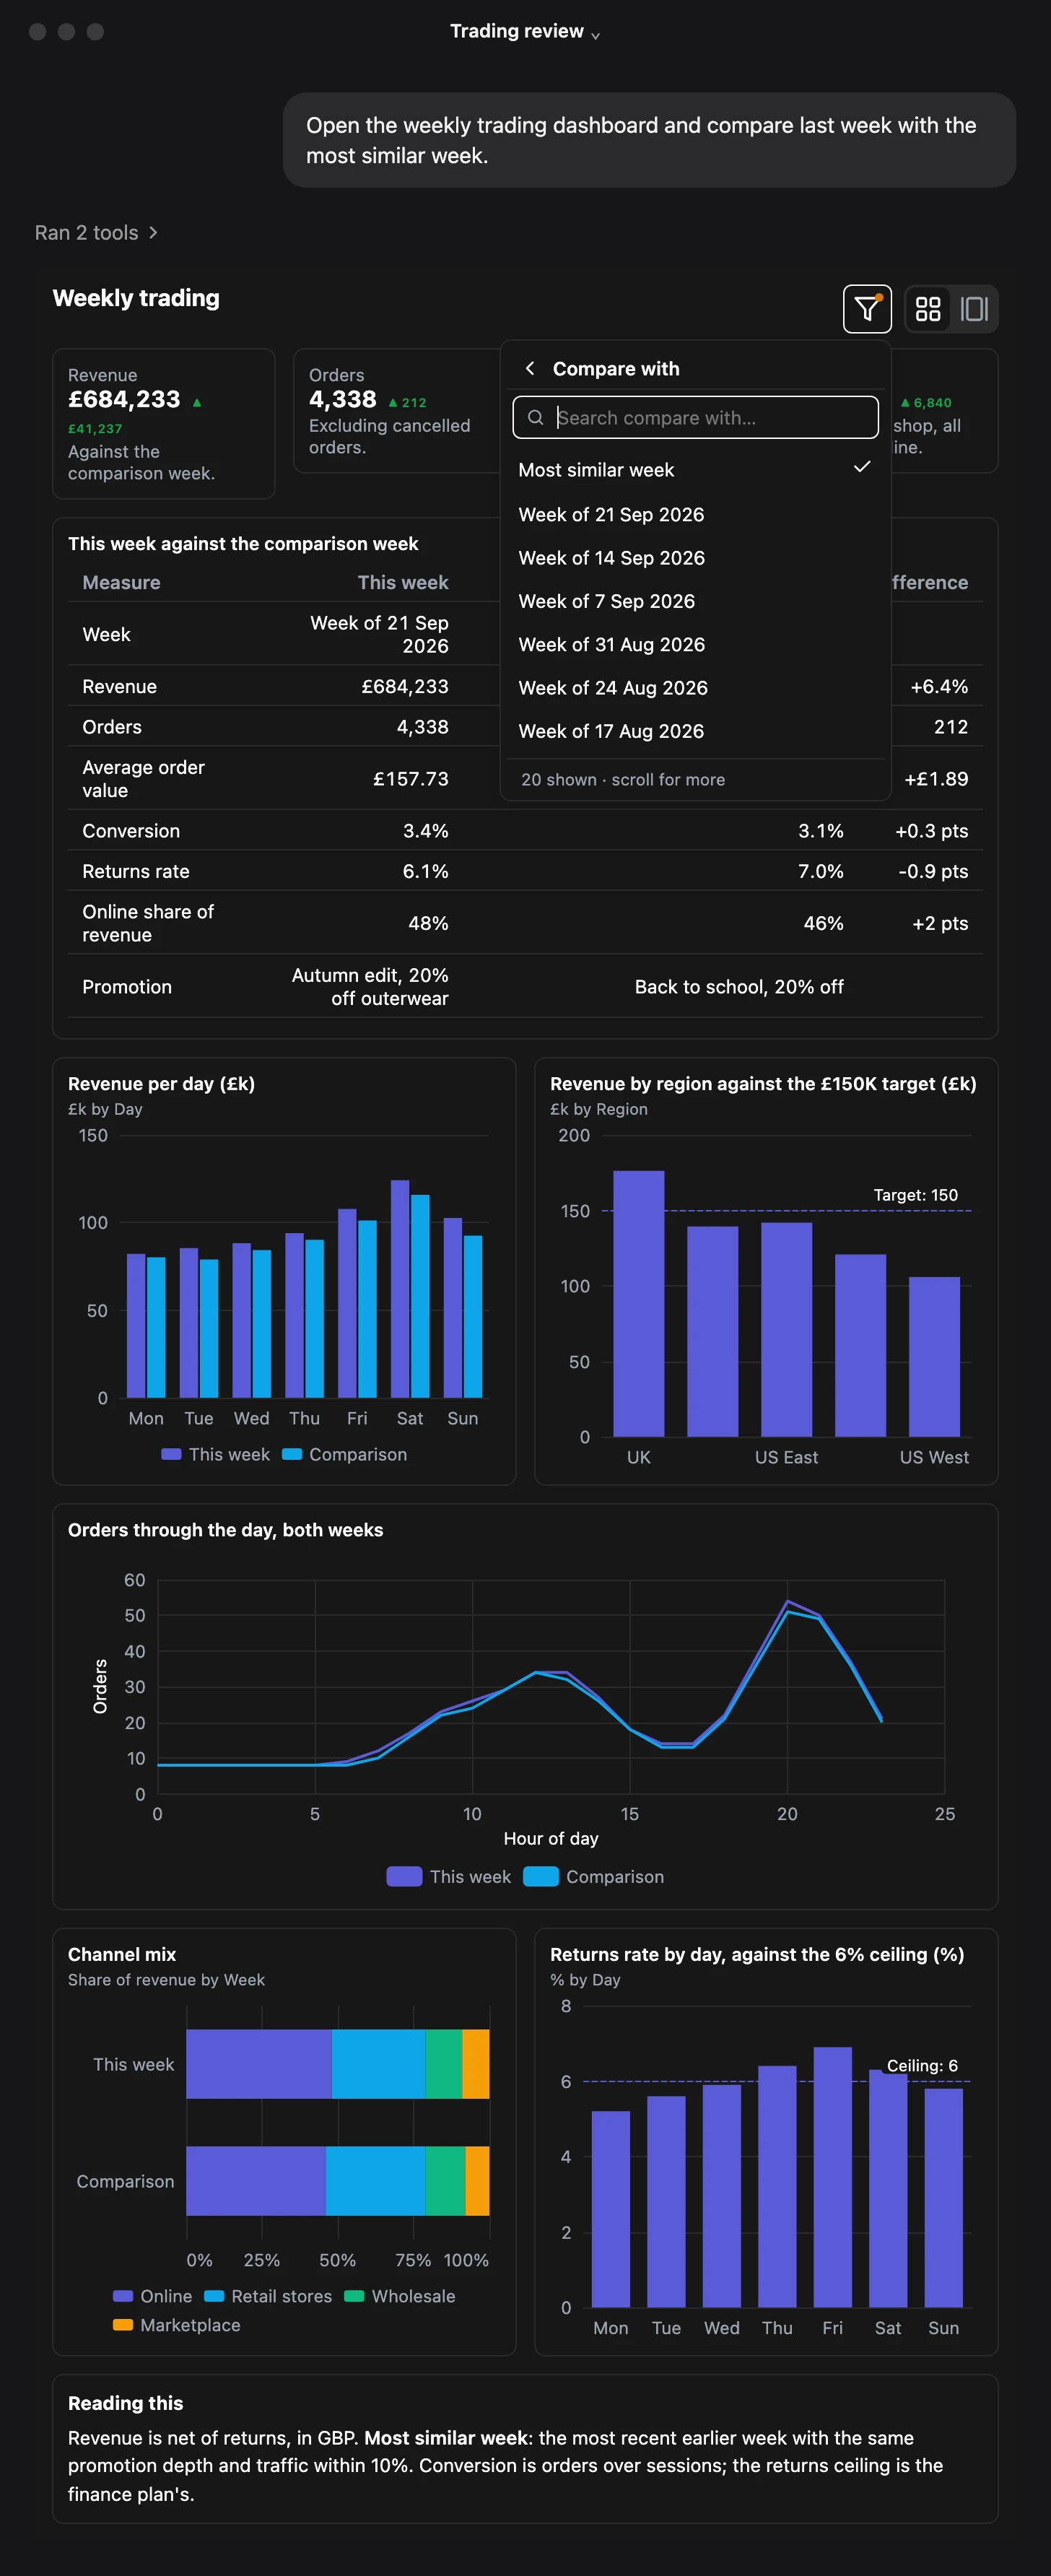
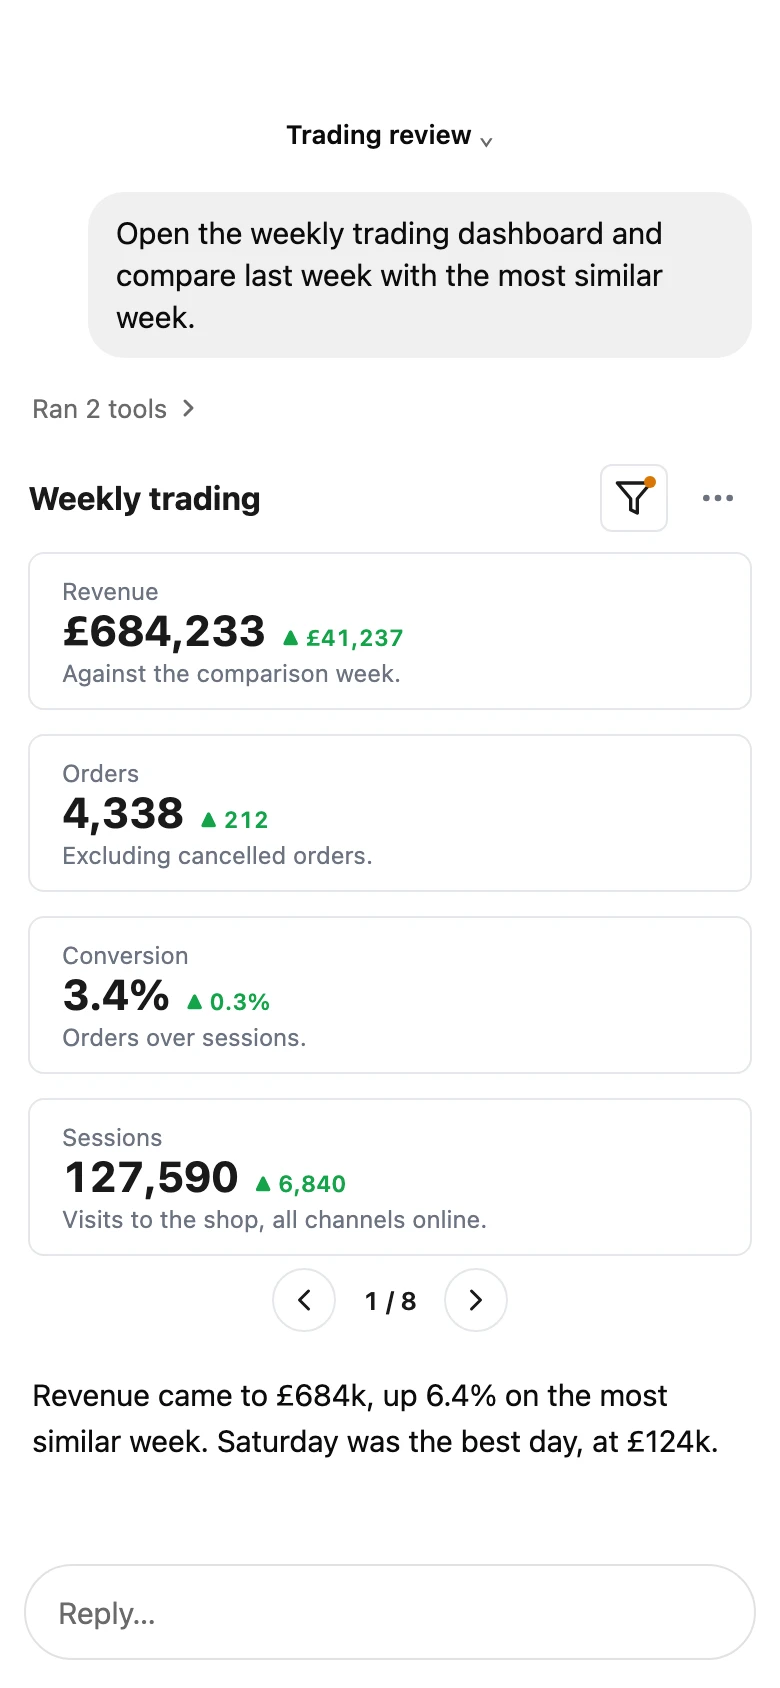
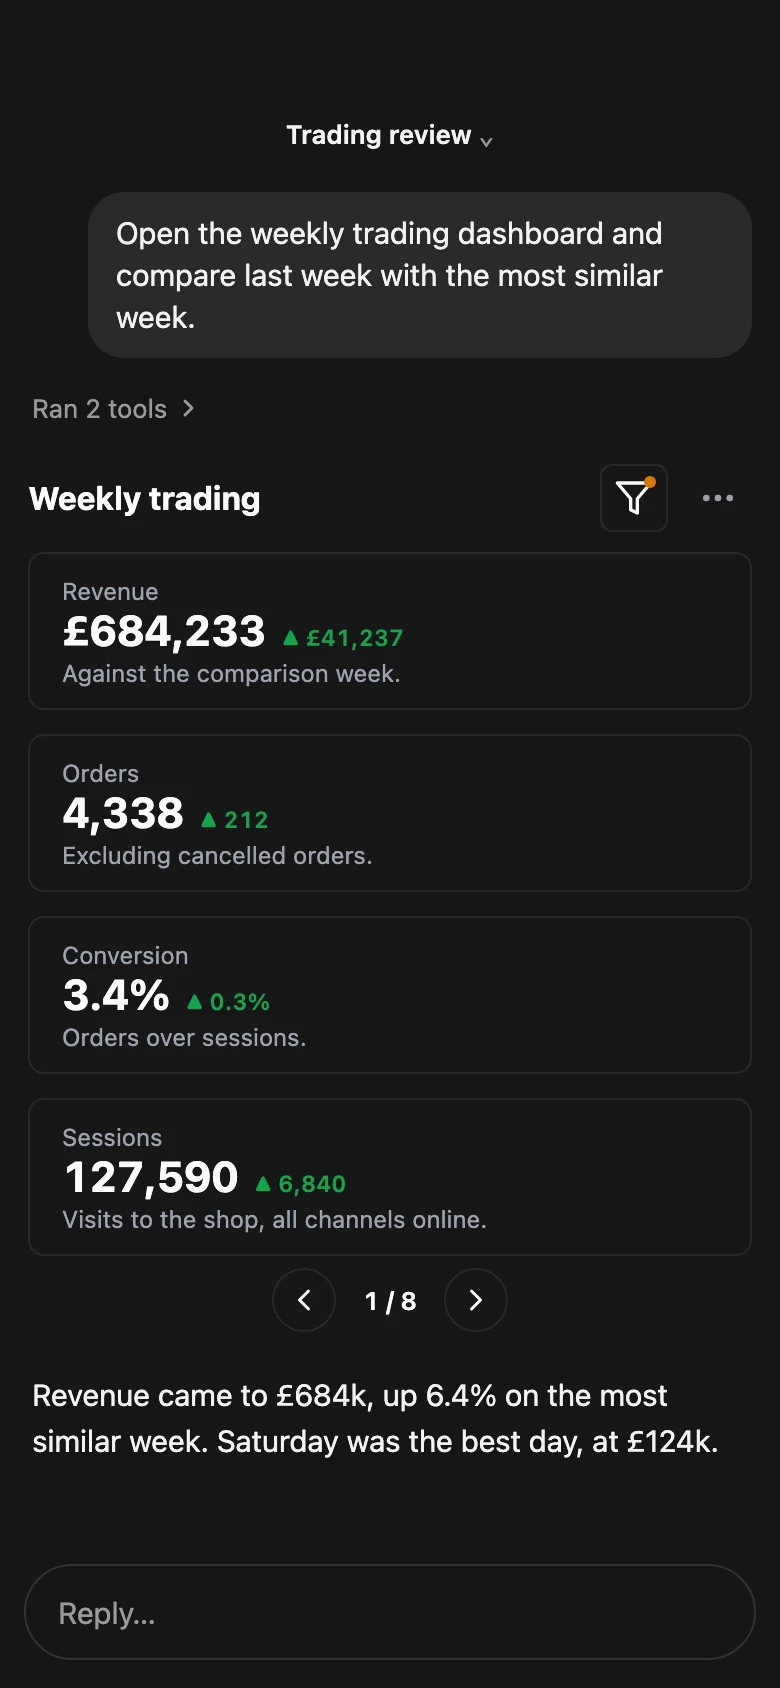
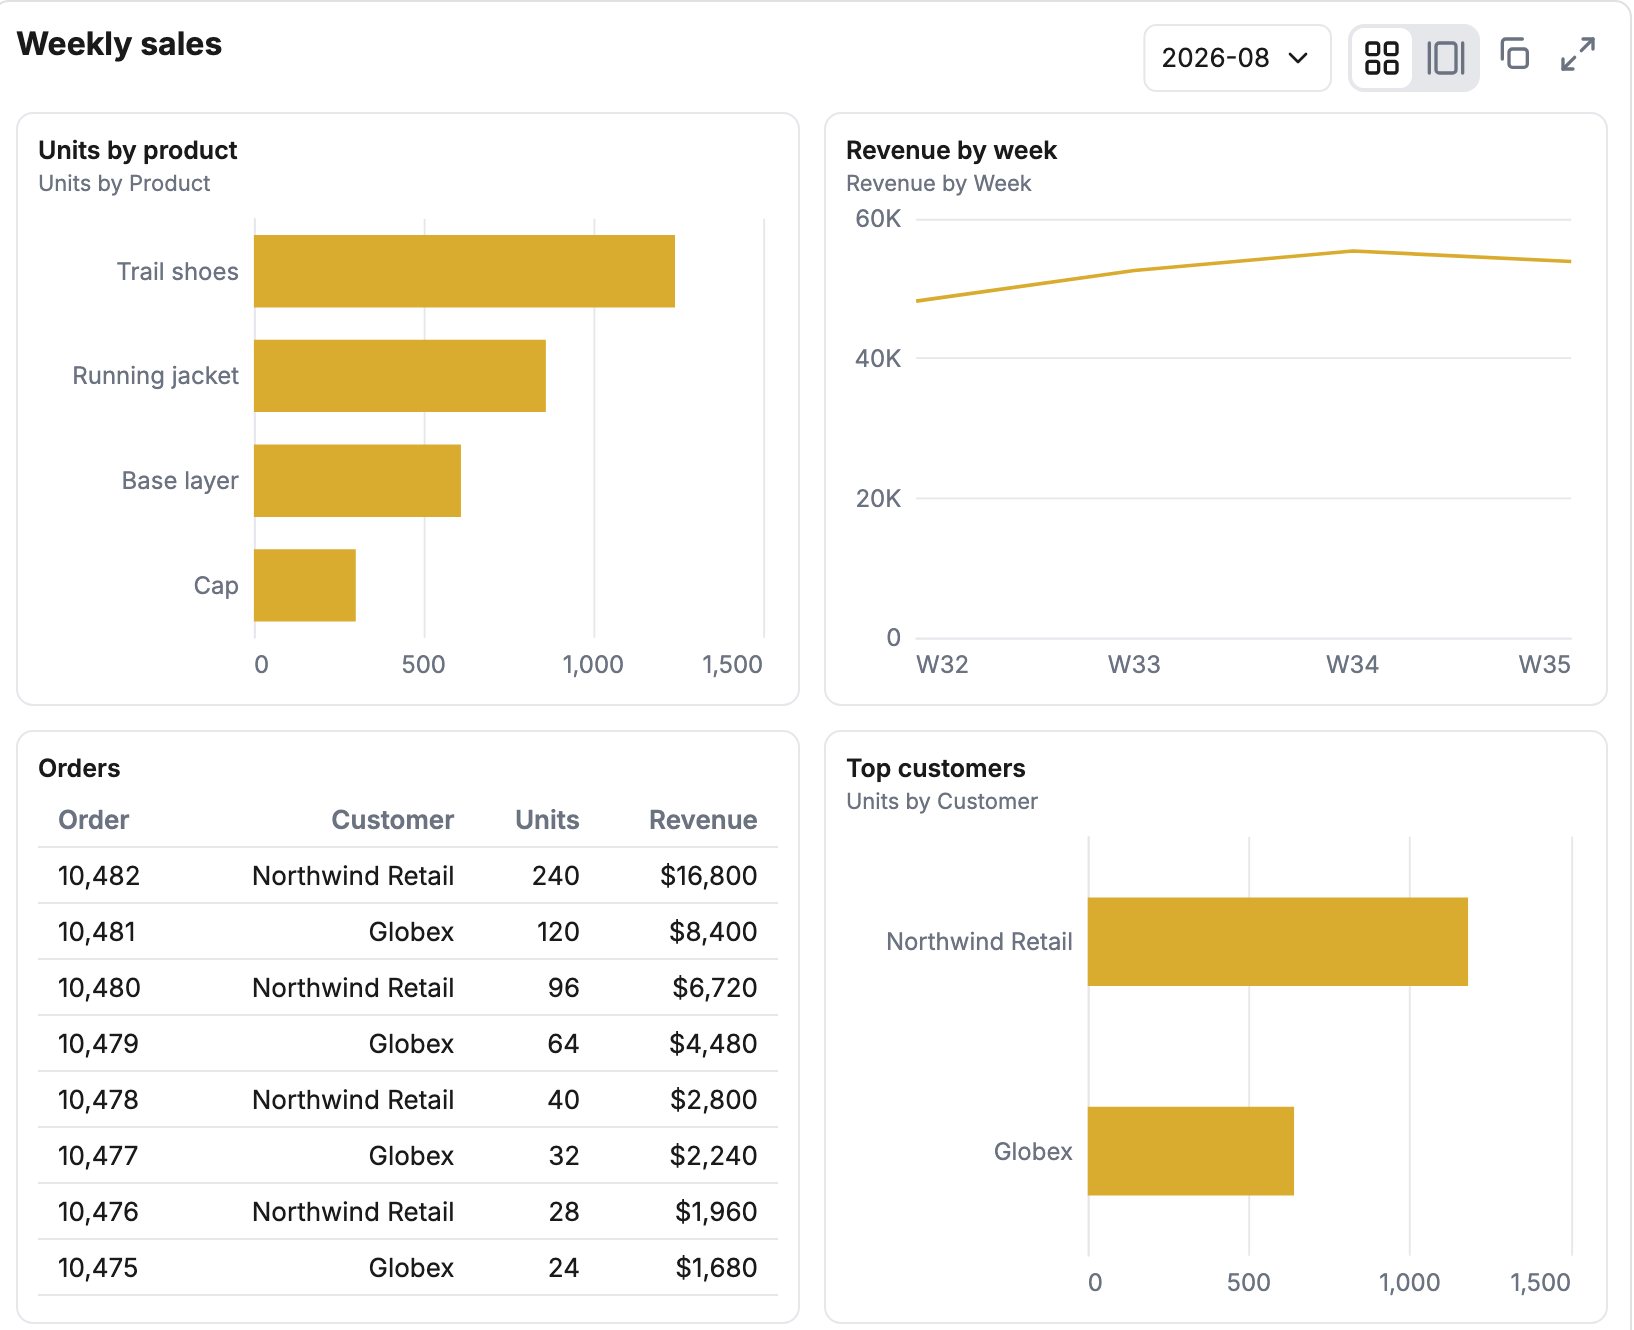
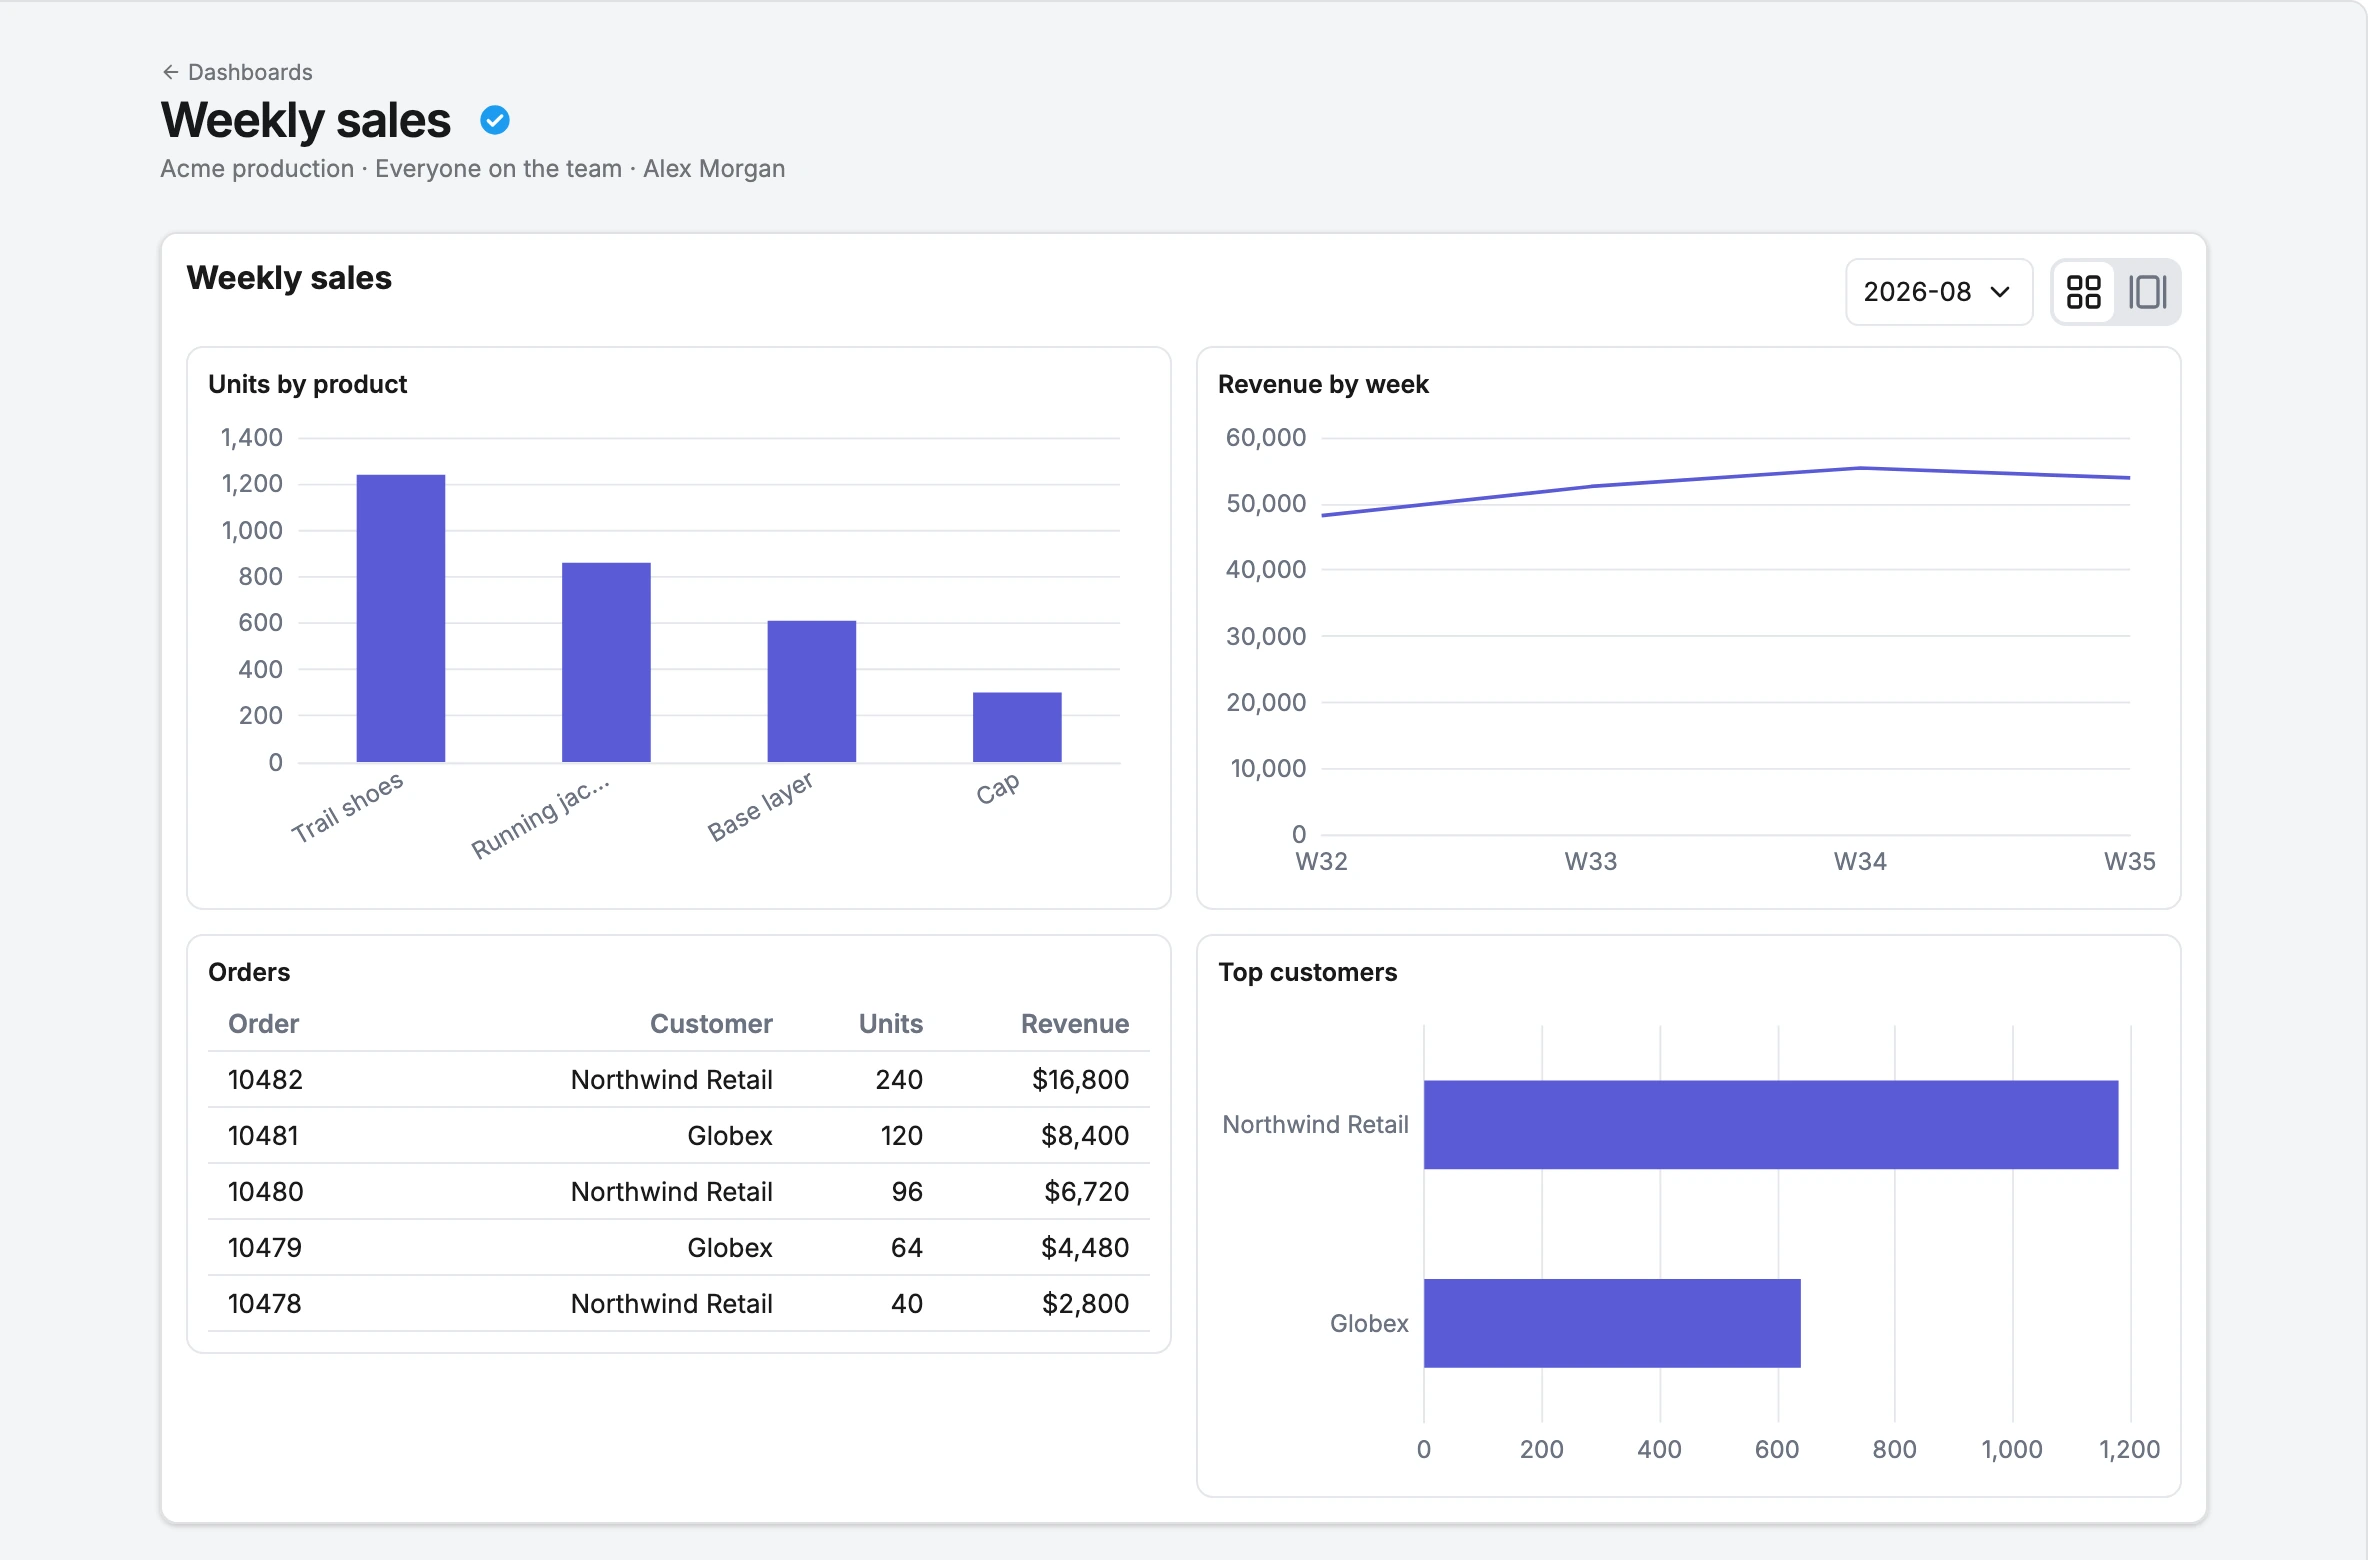
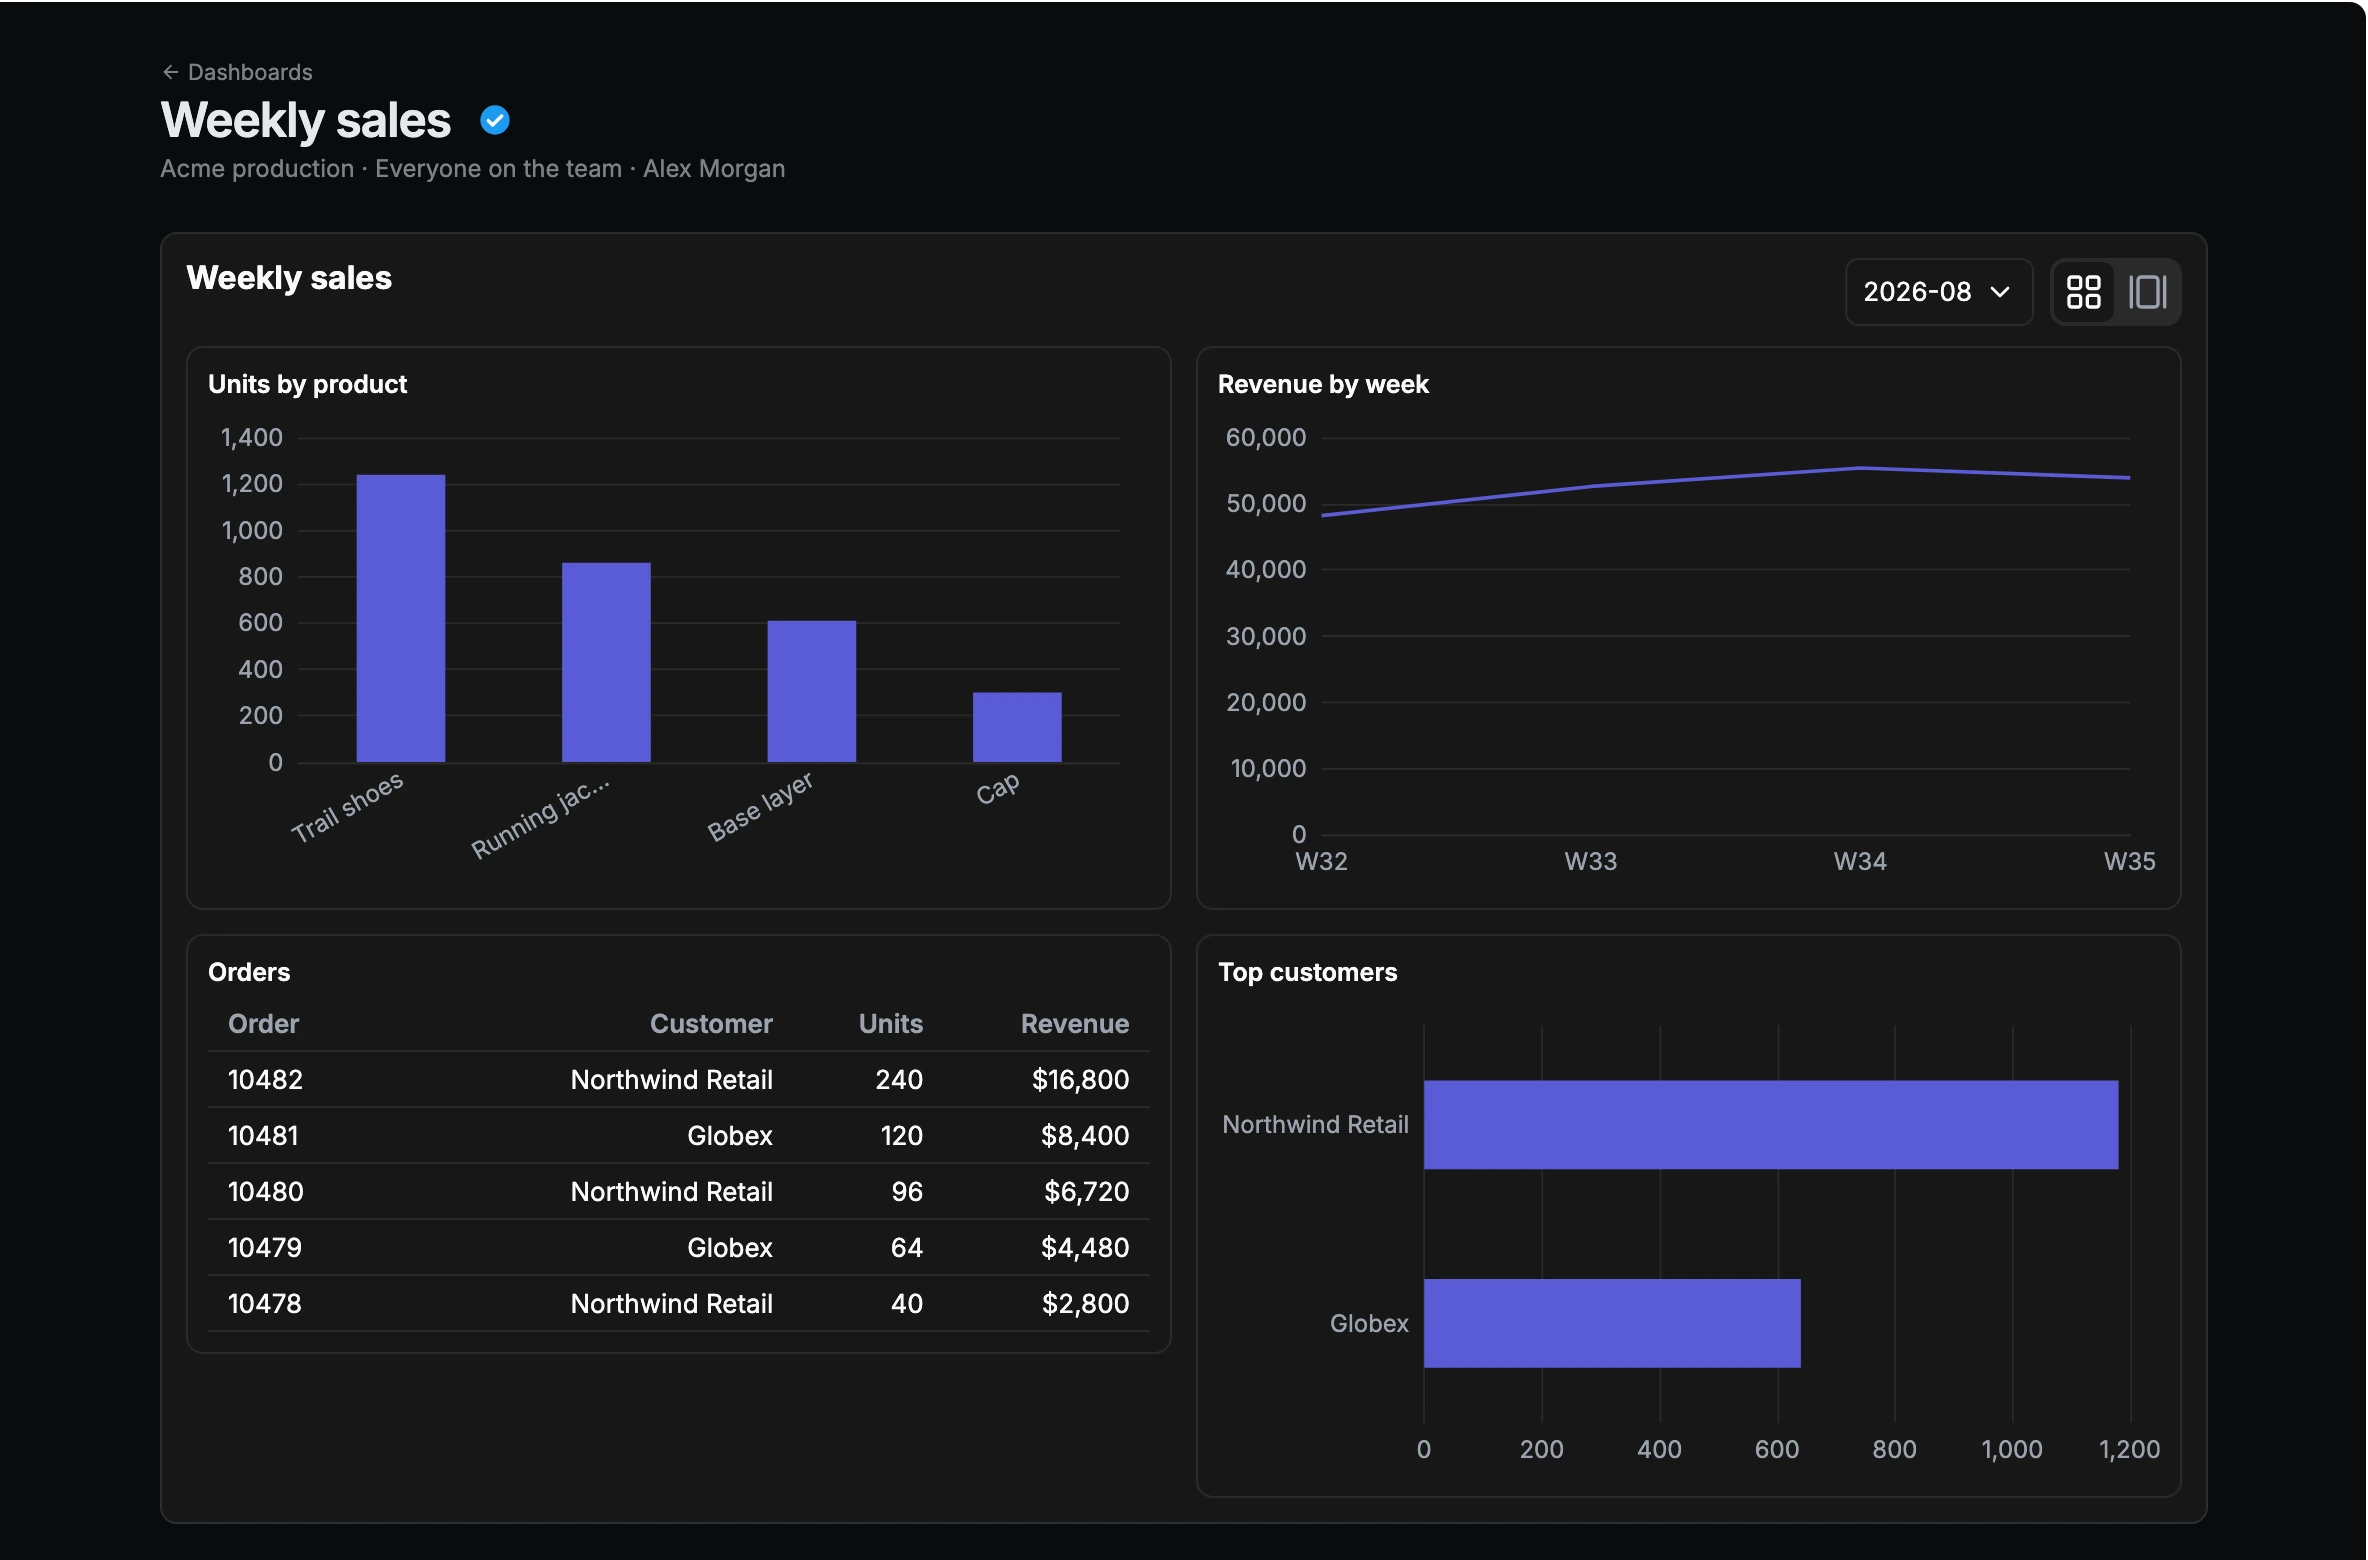
Dashboards. Saved and shared, with filters.
Chart types
- Line
- Bar
- Area
- Pie
- Scatter
- Funnel
- Waterfall
- Table
- KPI
Create it, then keep it
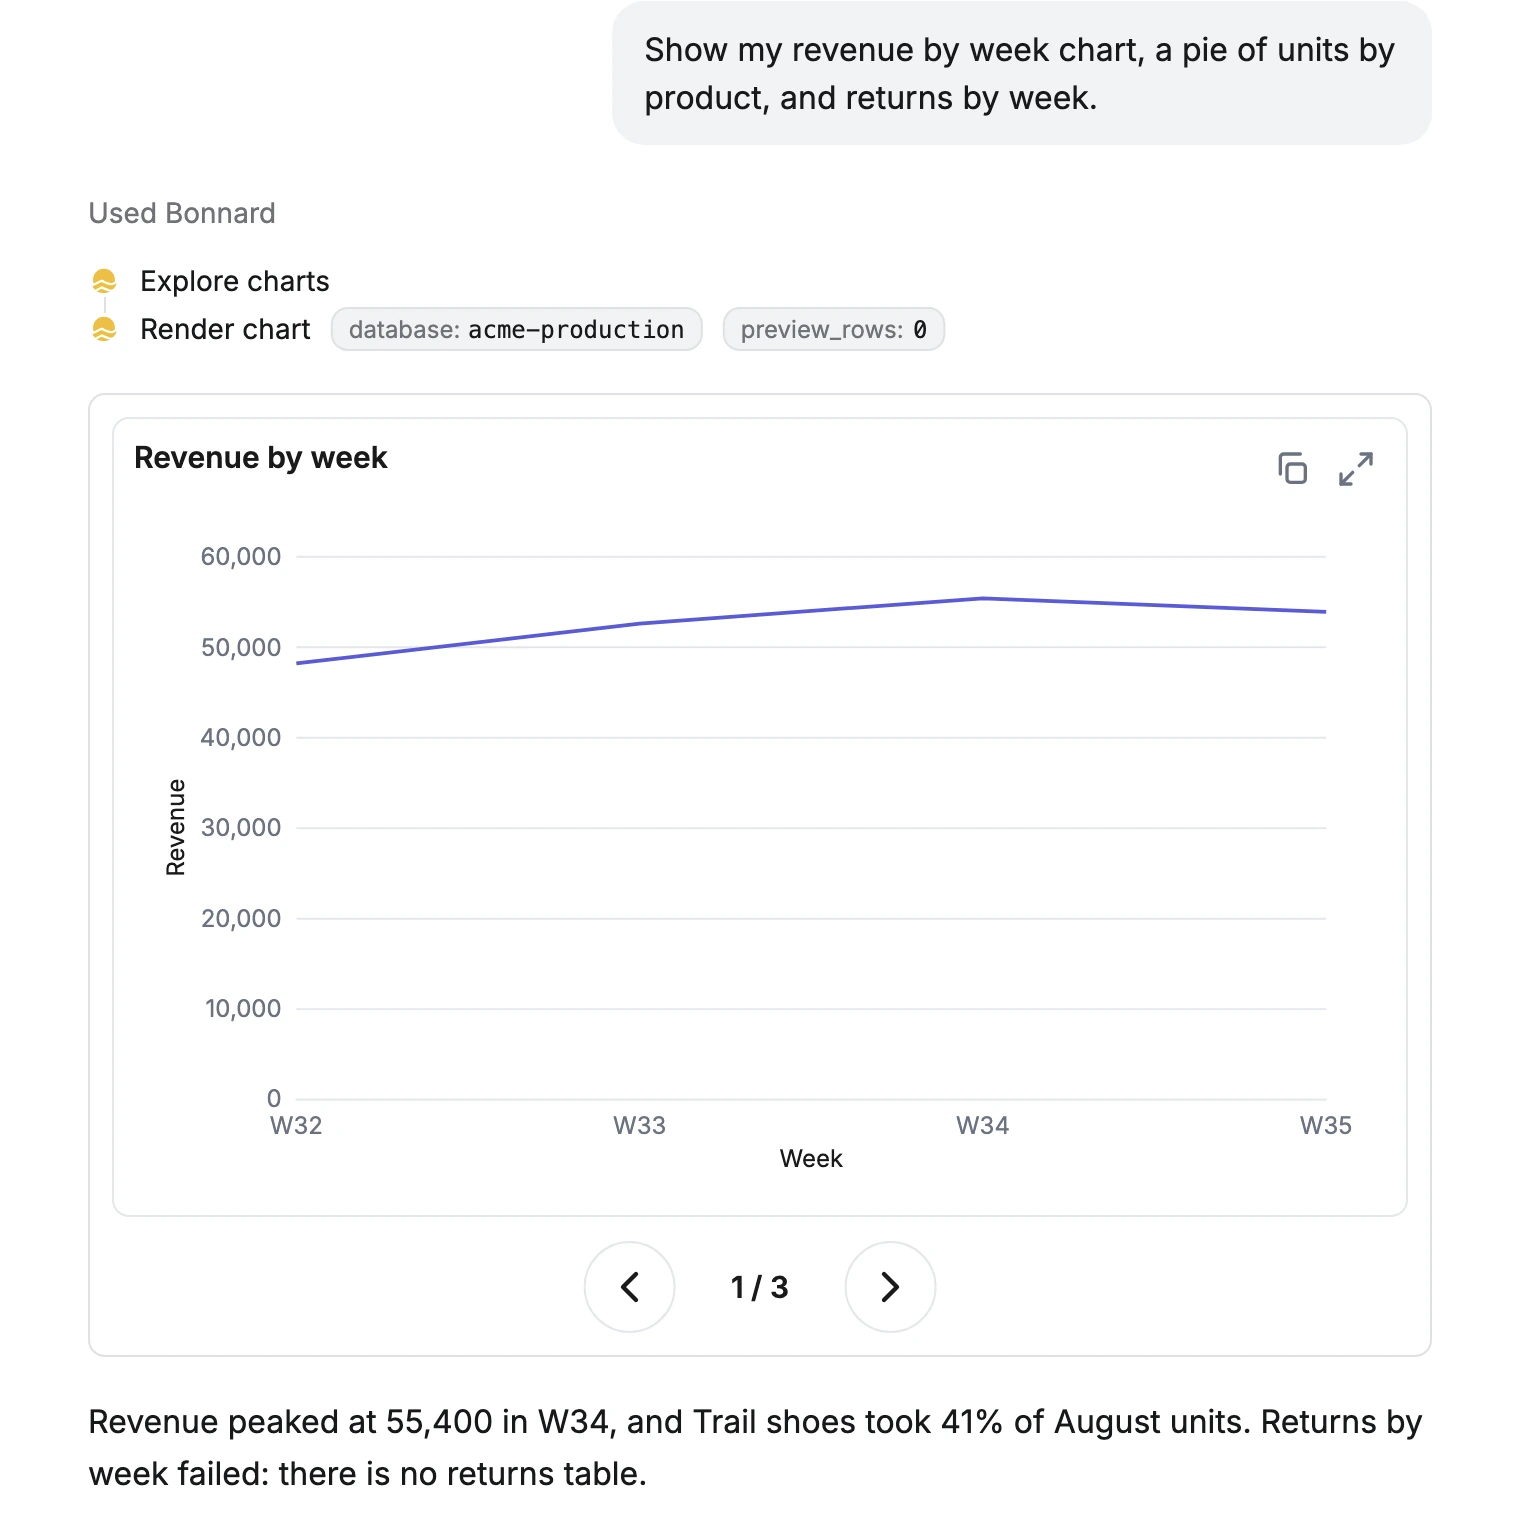
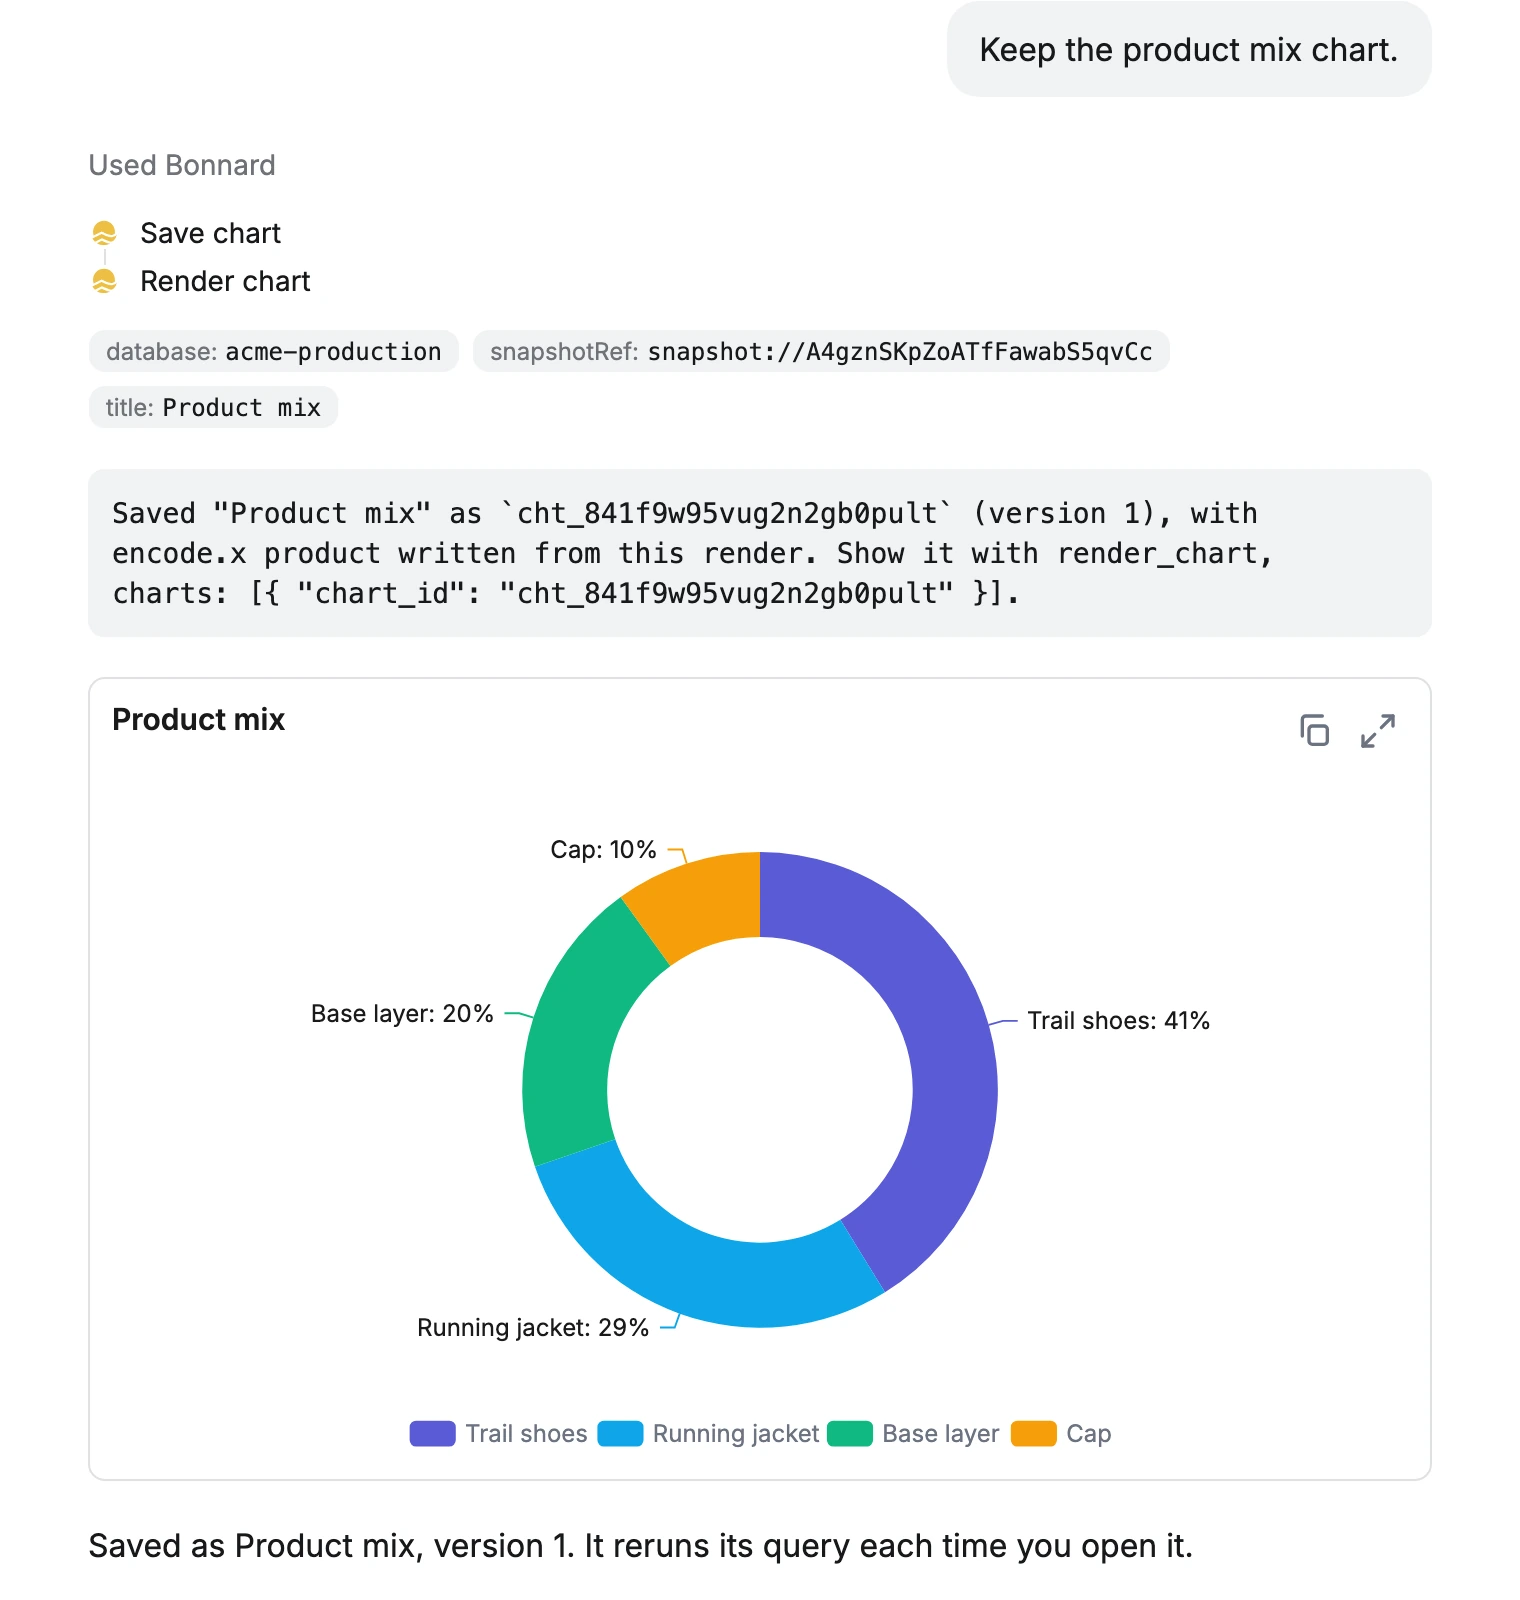
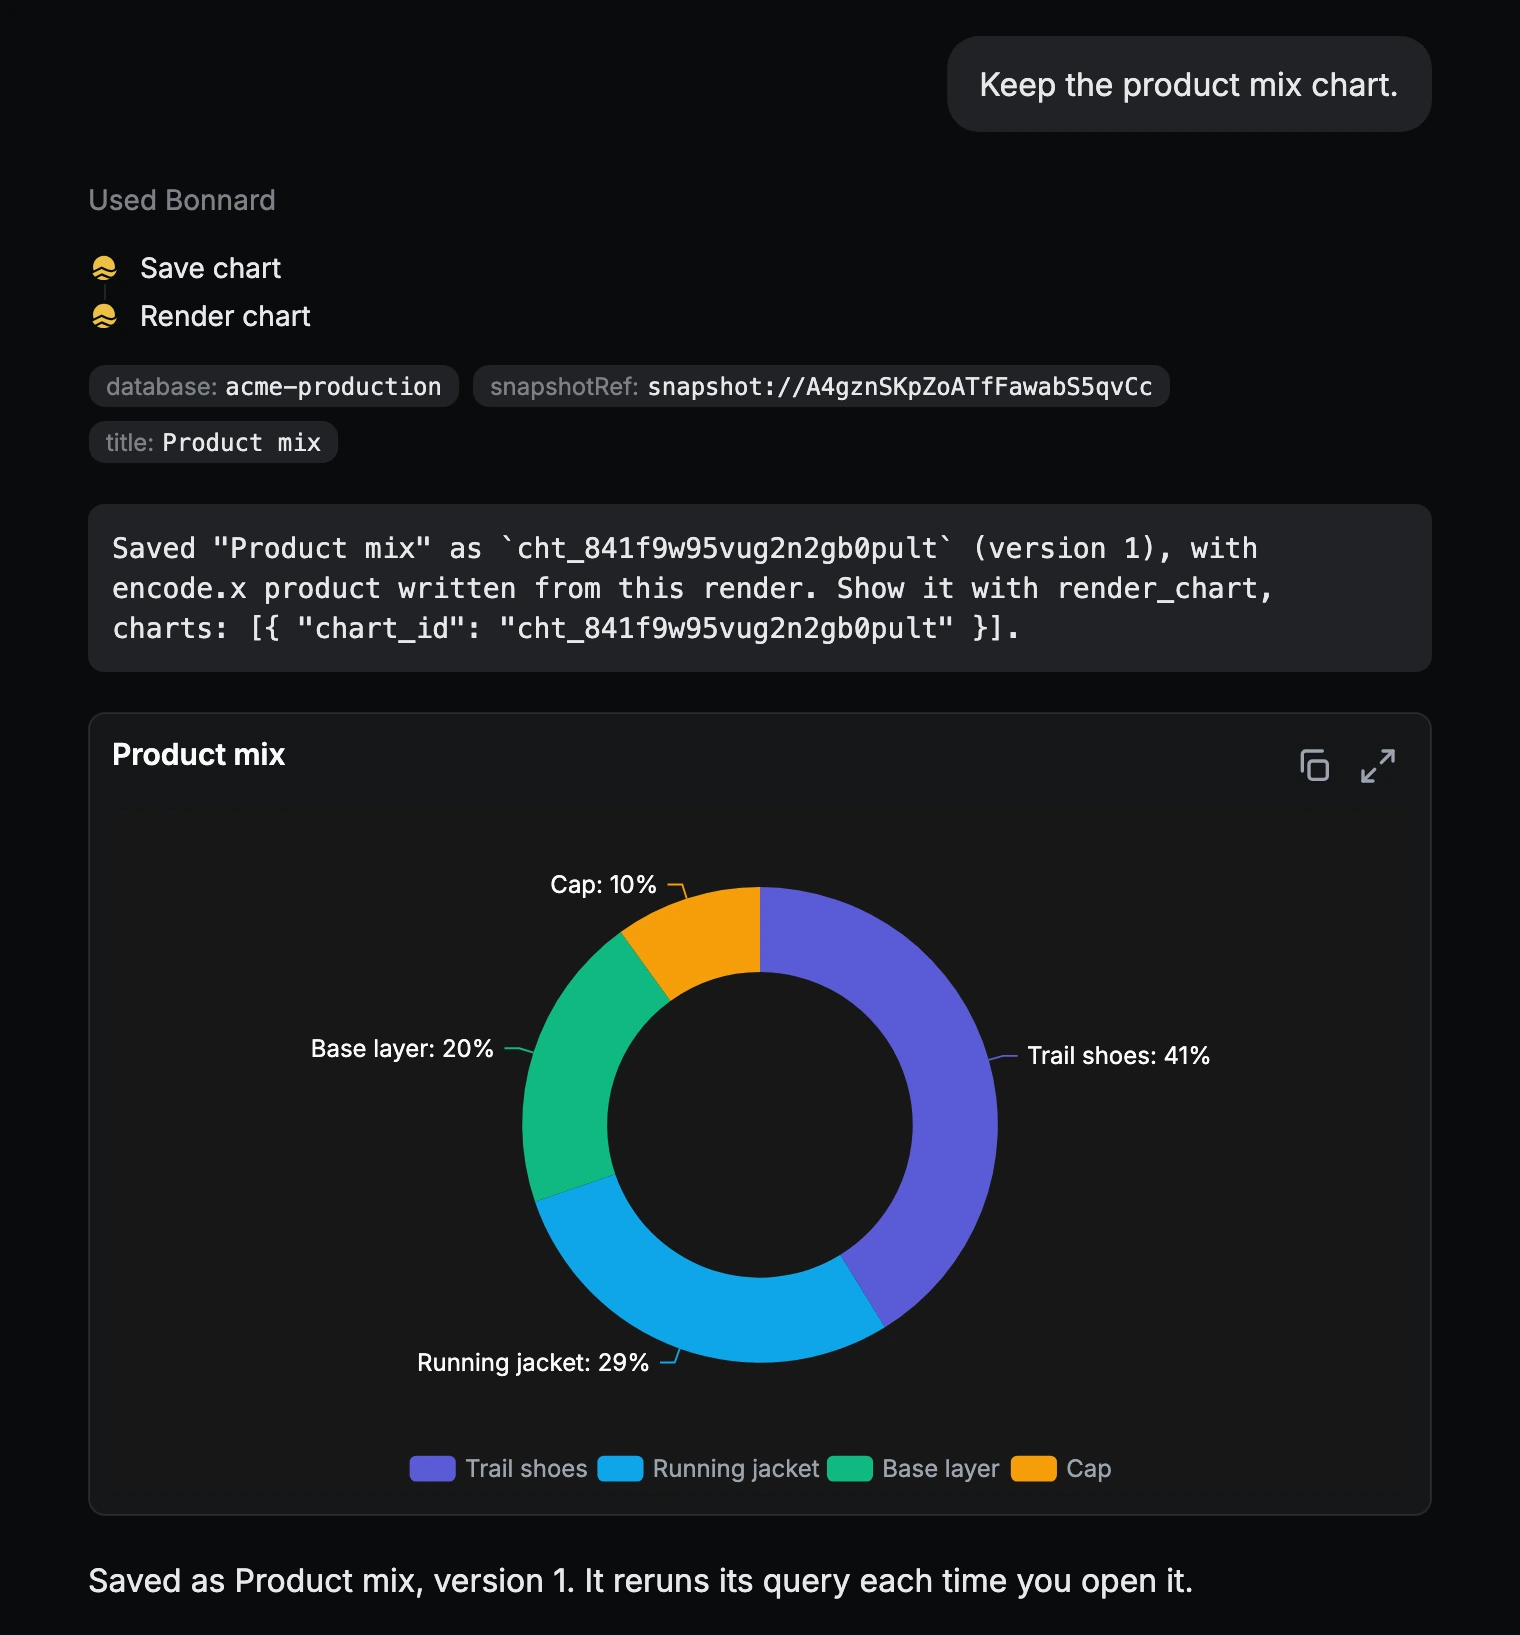
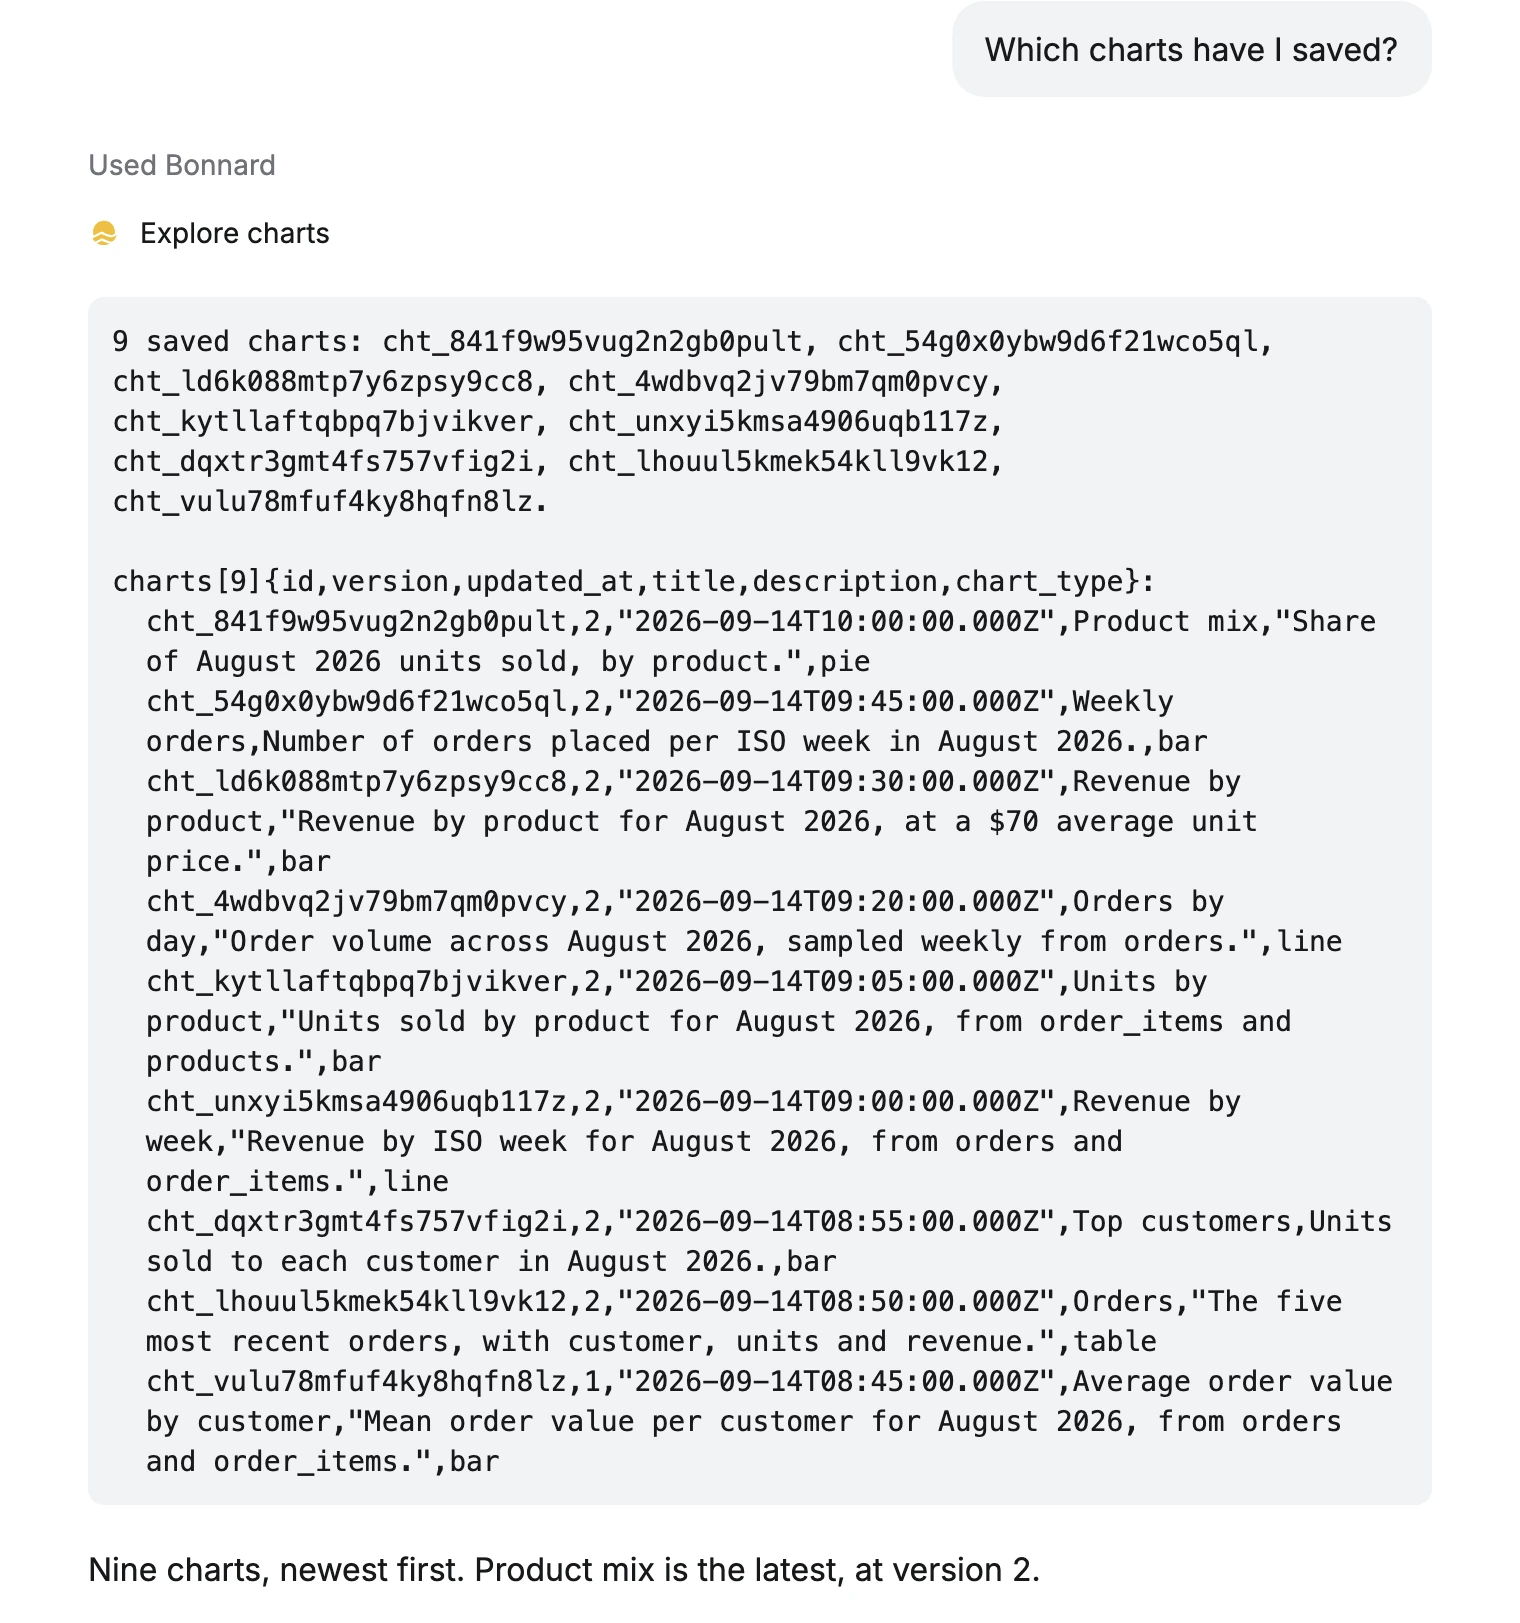
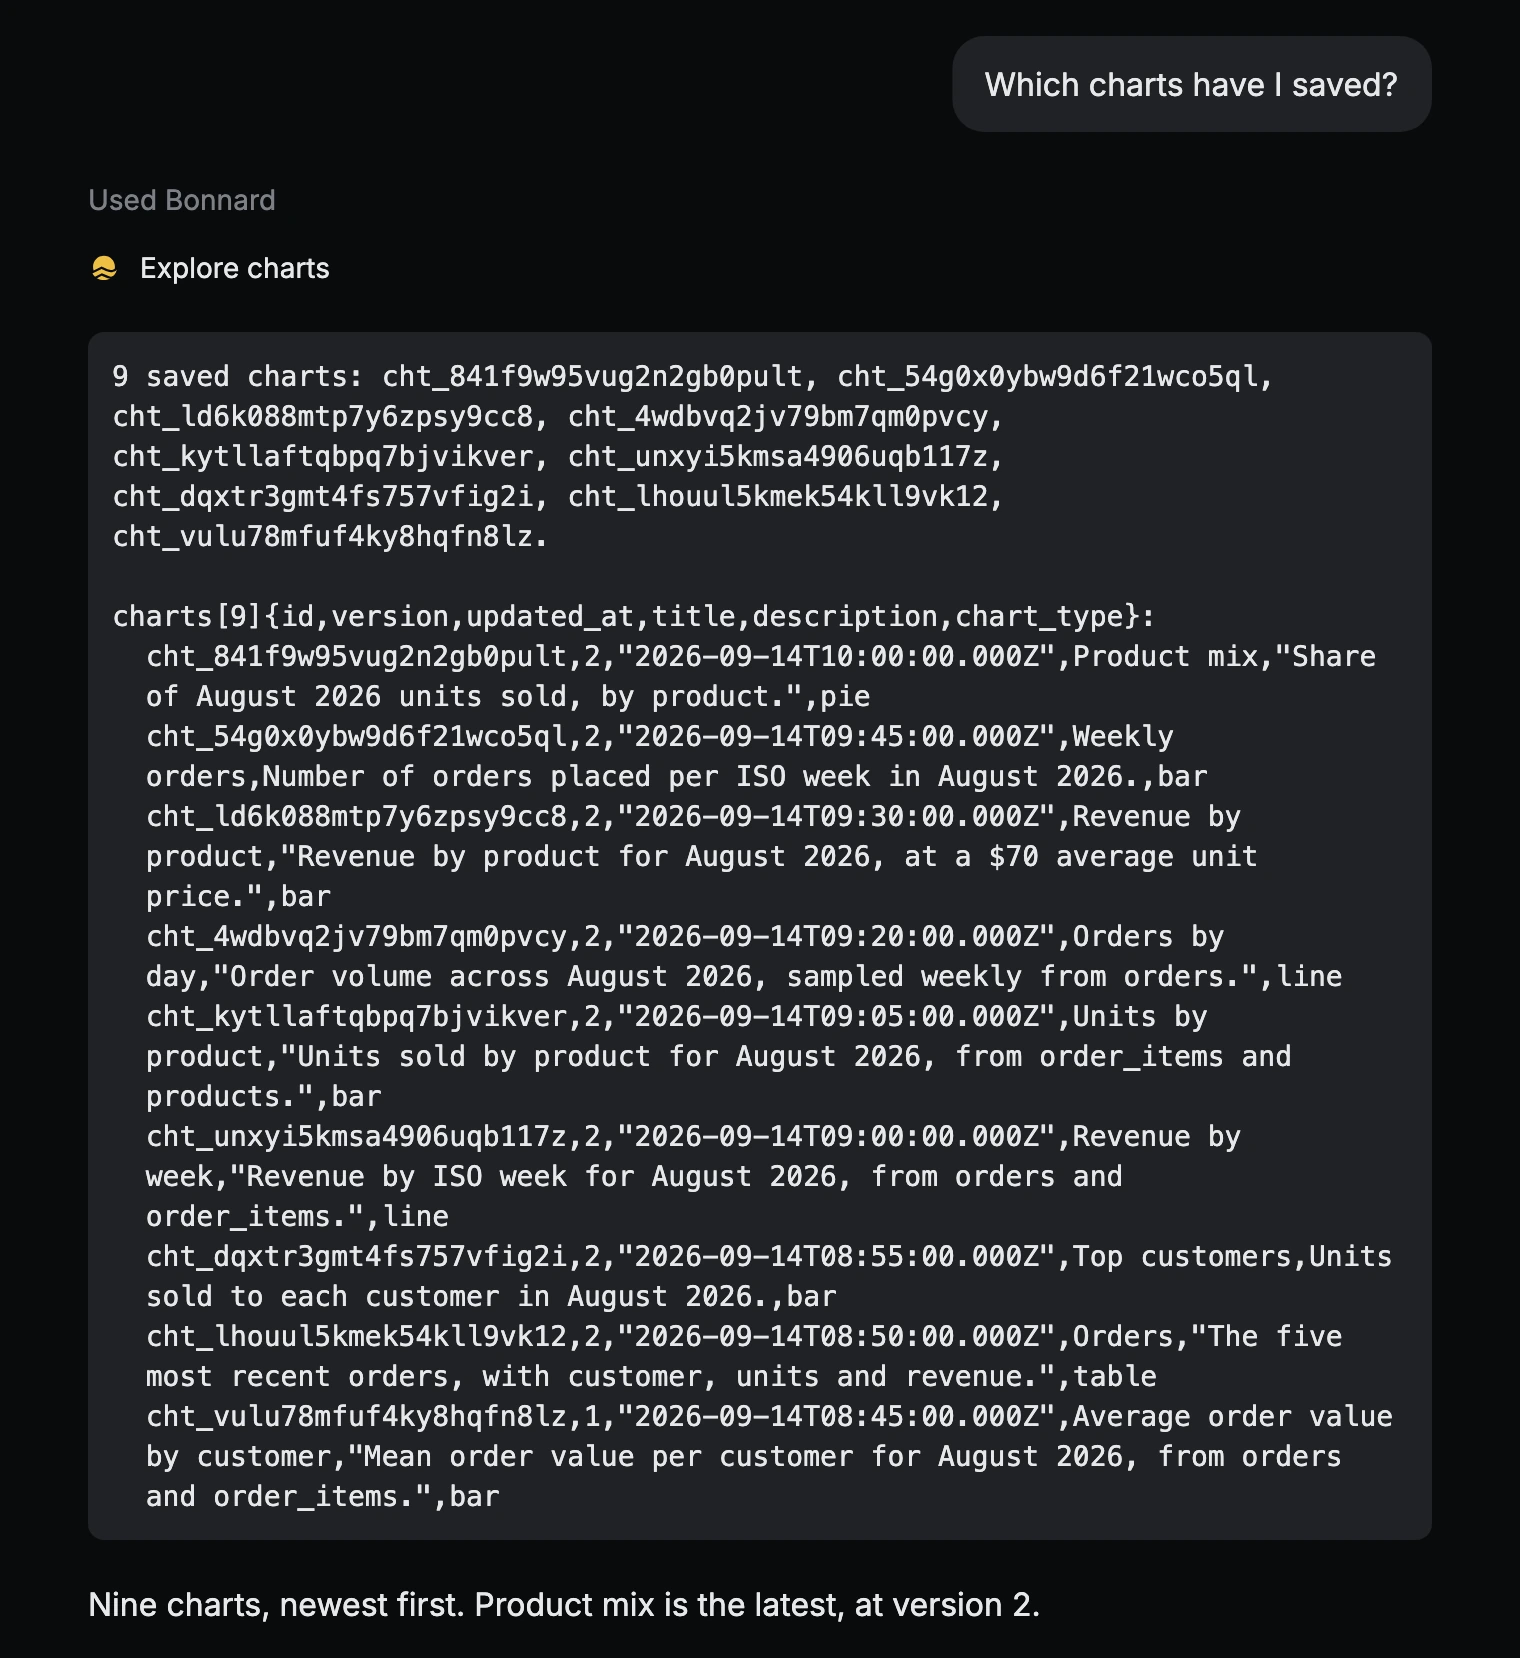
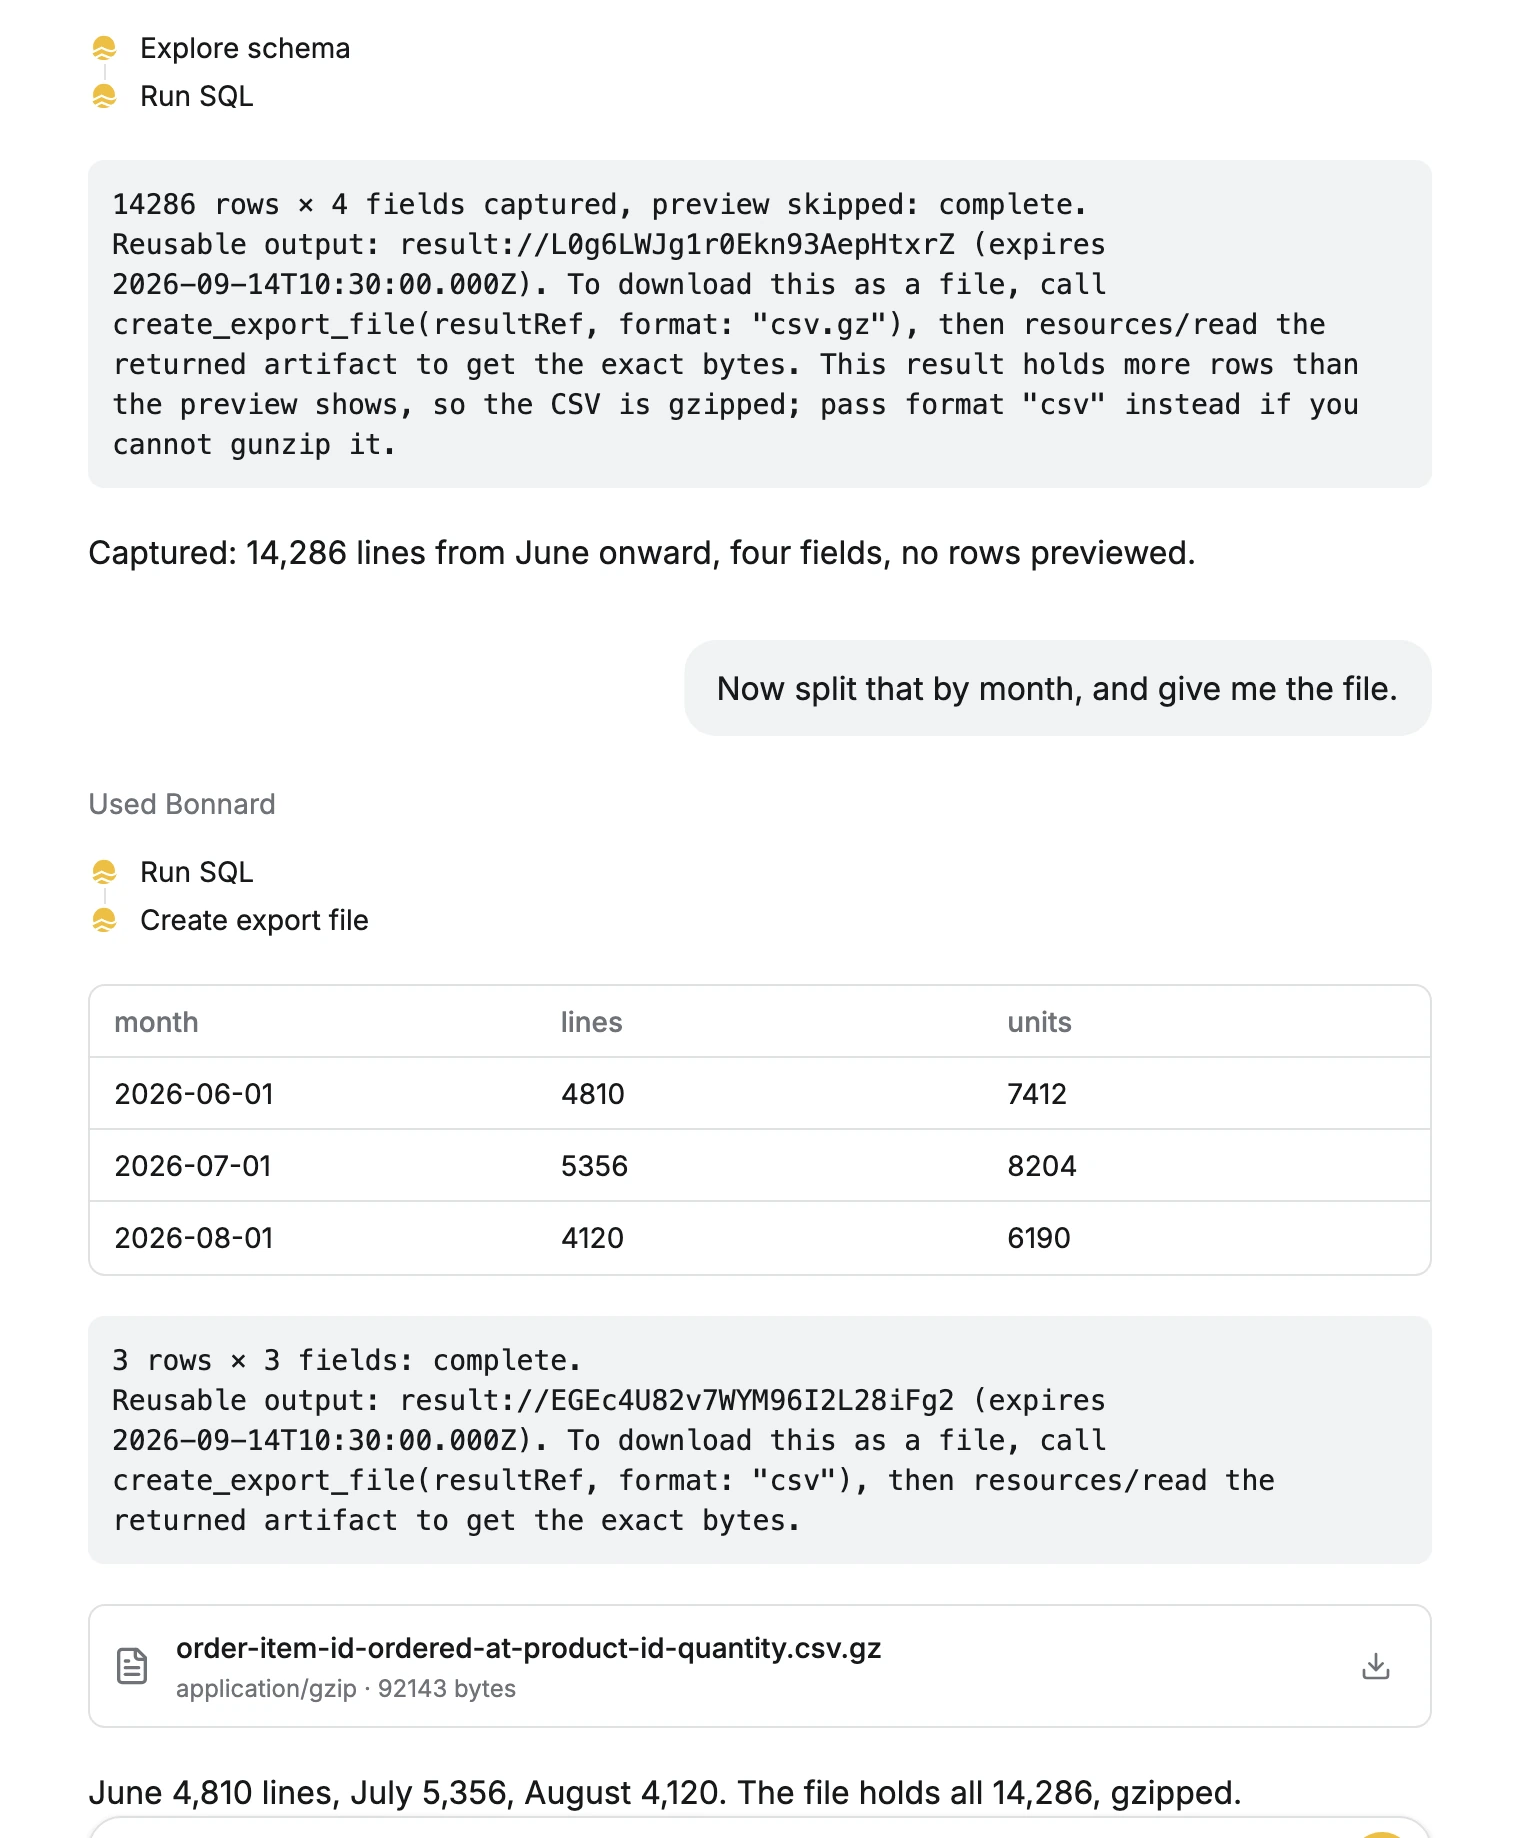
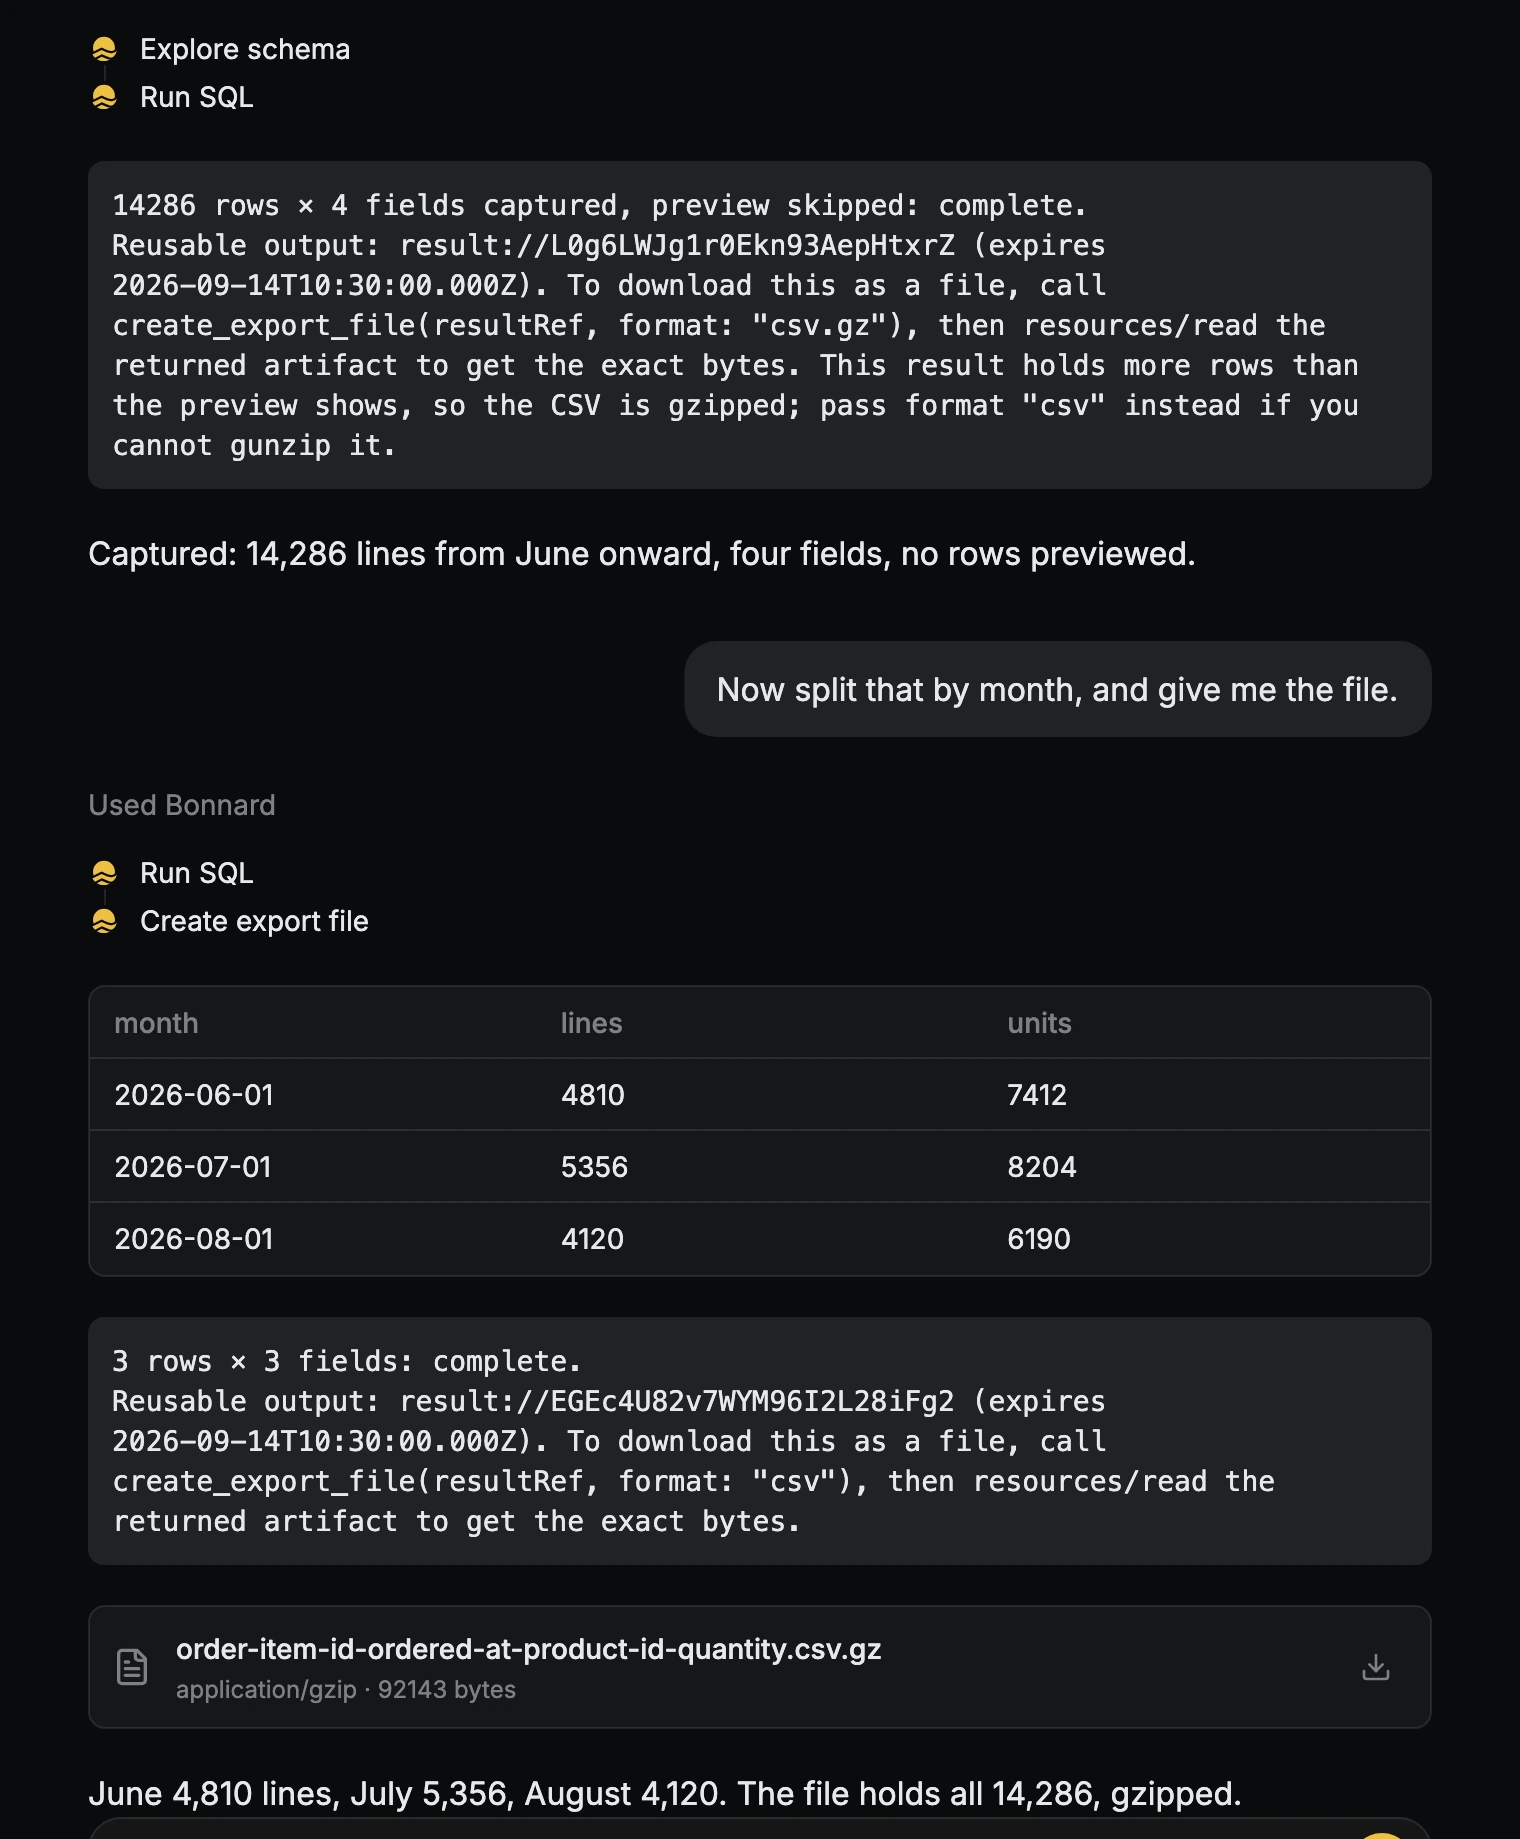
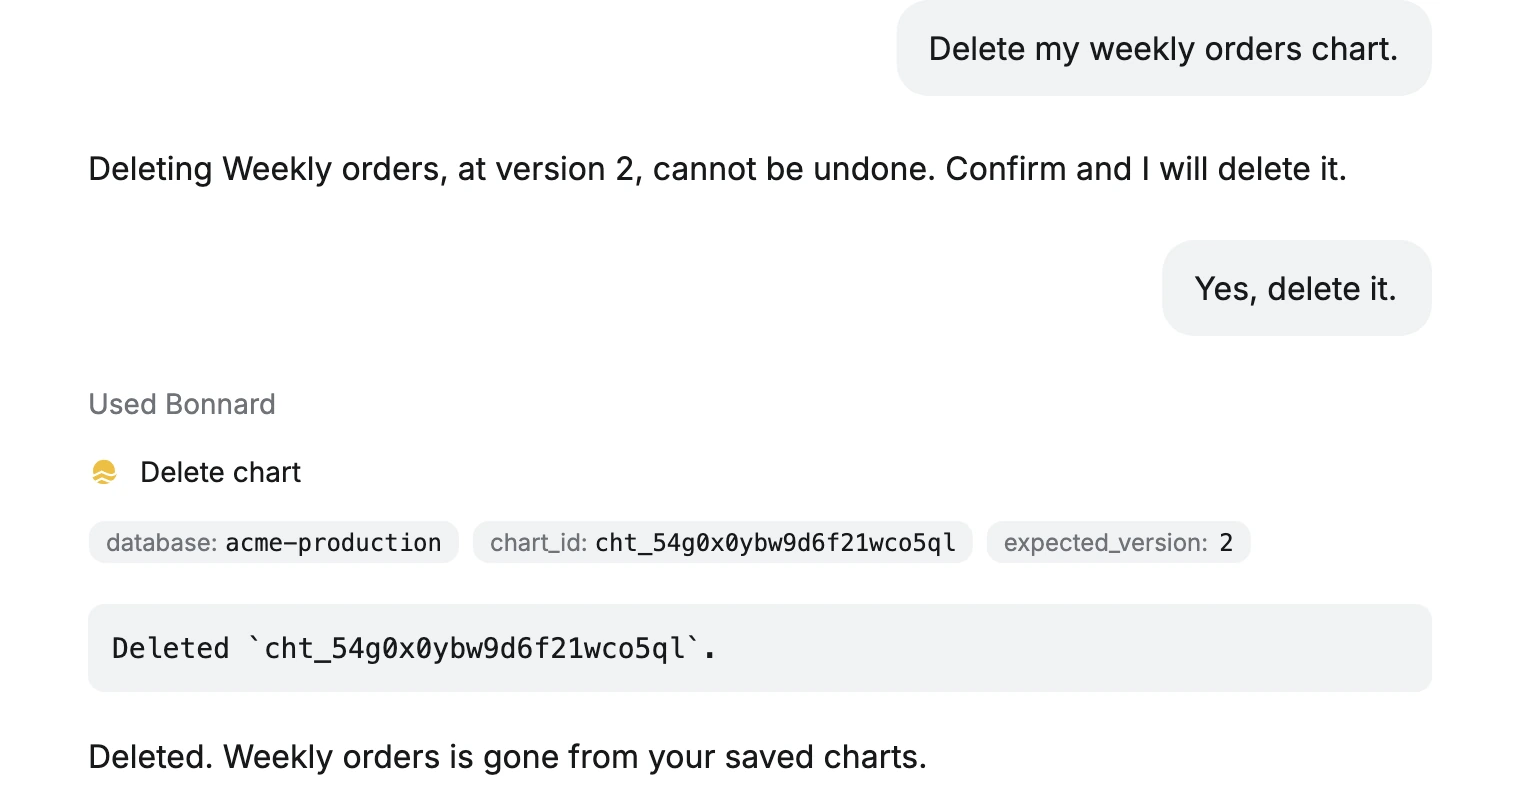
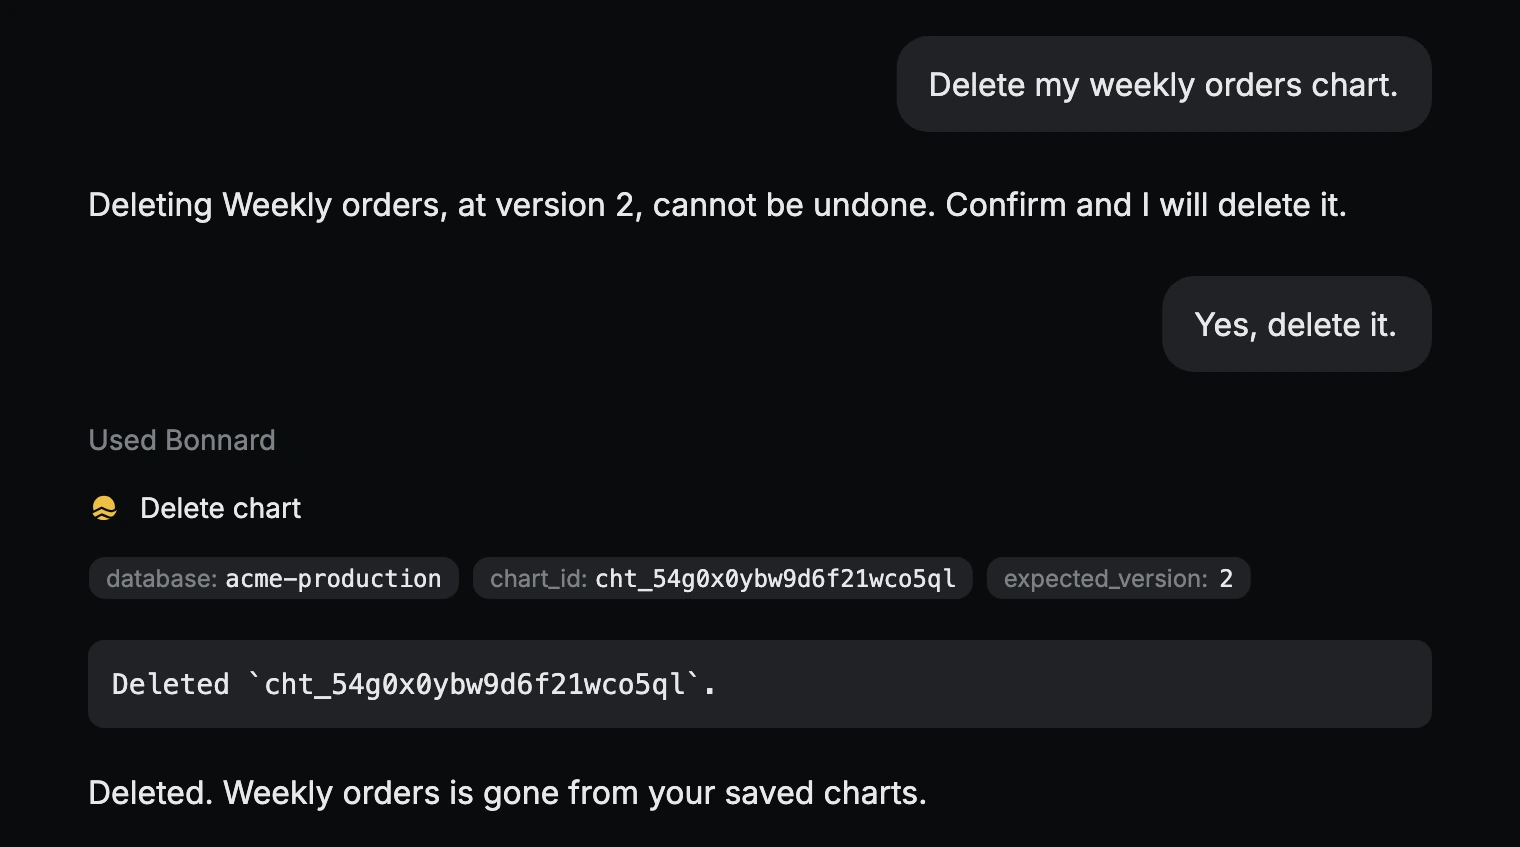
Every chart can be saved, found or exported by asking your agent.
Verified dashboards for the whole team
People can save their own. The ones you verify are listed first, and you choose who gets them.
Share "Weekly sales"
Add people, groups or customers
- AMAlex Morganalex@acme.exampleOwner
- EOEveryone on the team3 peopleAdd
- ACAll customersIncluding customers added laterAdd
Copy linkDone
render_dashboardShows a dashboard in the chat as an interactive grid of tiles.save_dashboardSaves a dashboard for this person, or edits one they saved.explore_dashboardsLists the dashboards the agent can show: verified, shared and saved.delete_dashboardDeletes one of the person’s own dashboards. Verified ones stay.fetch_view_dataLoads a rendered dashboard’s data into the chart. Called by the chart, not the agent.search_param_valuesFinds the values for a dashboard’s filter menu. Called by the chart, not the agent.
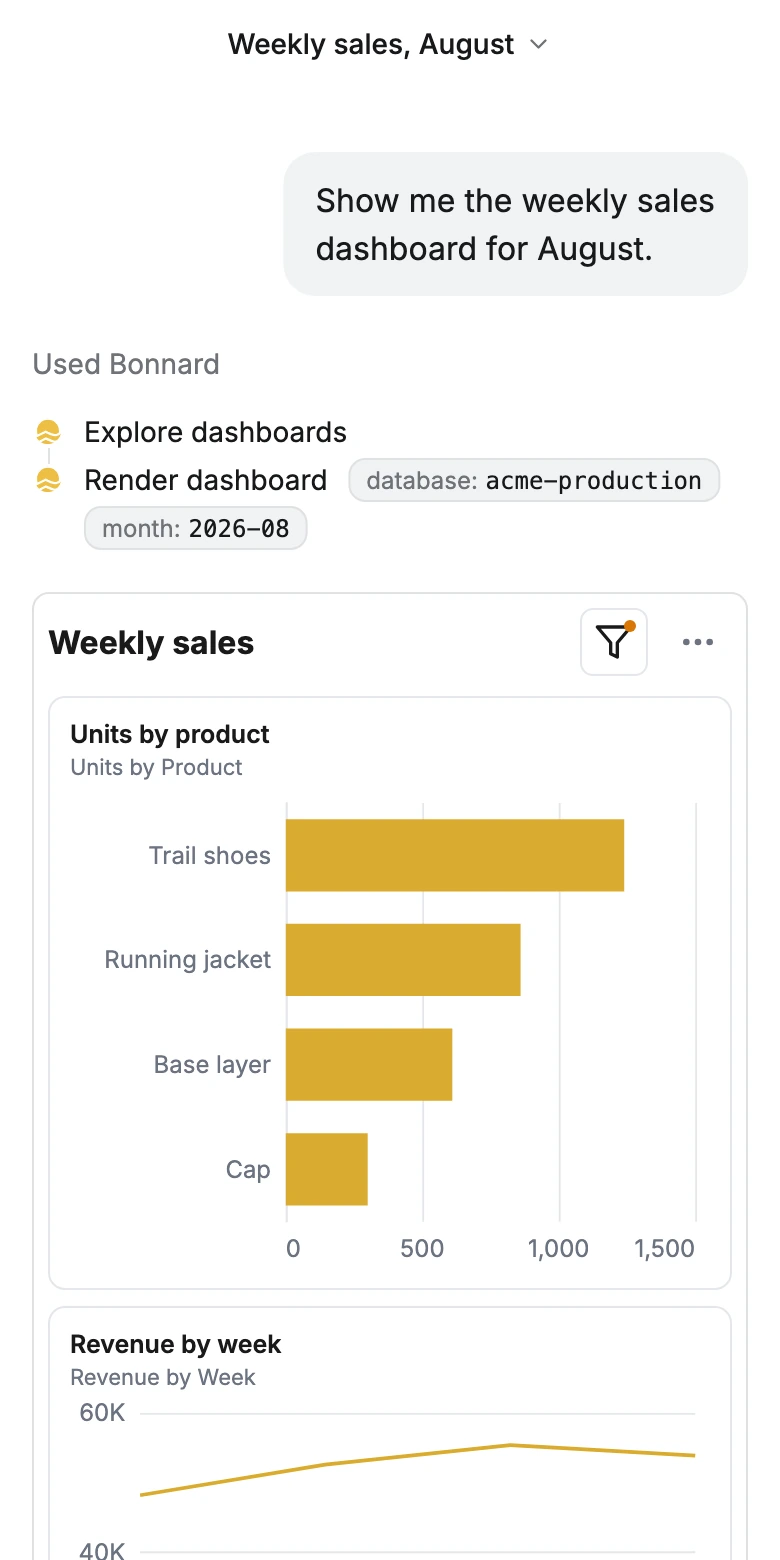
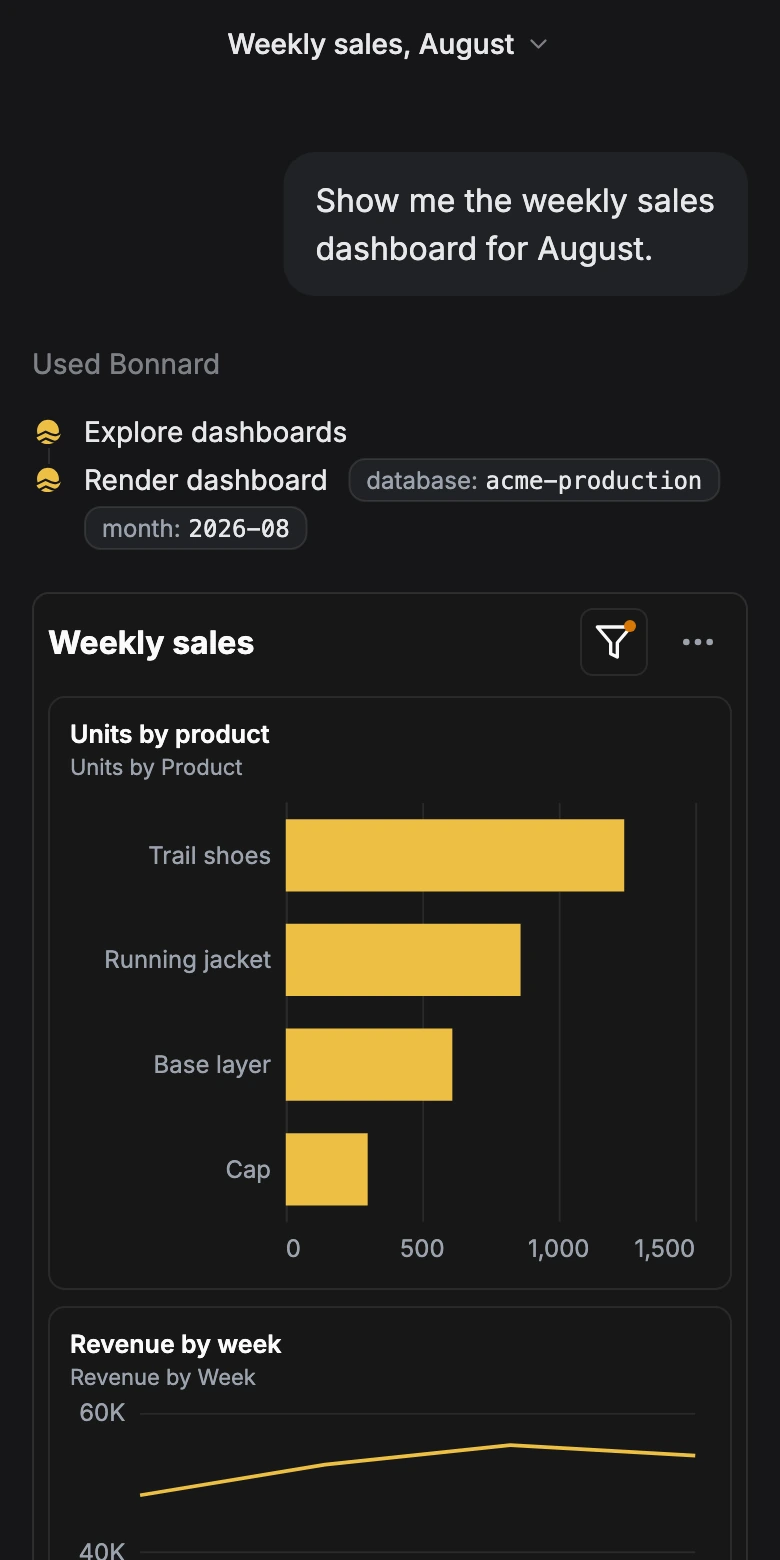
Responsive to your device
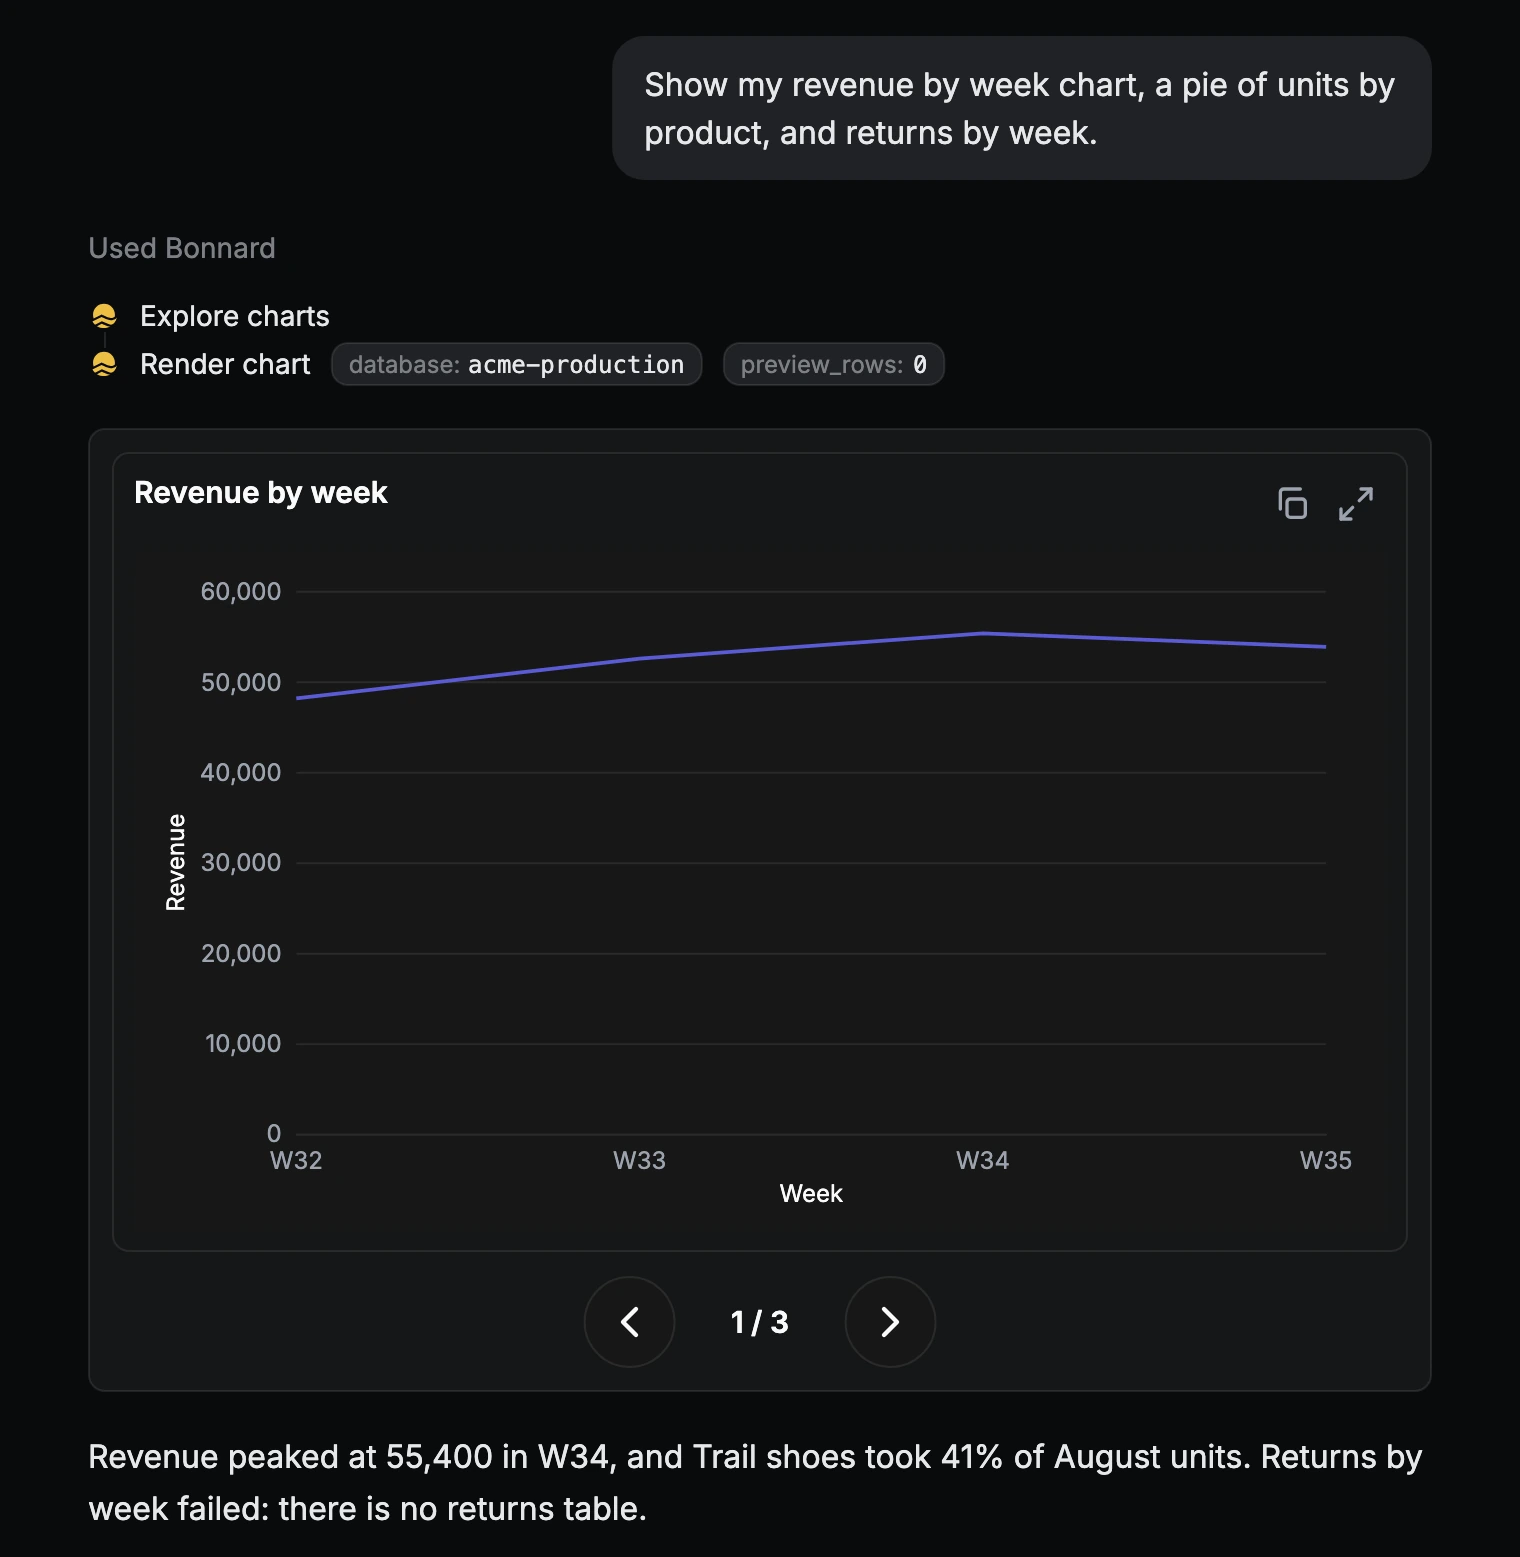
Charts and dashboards adapt based on where you are working with your data.
In the chart
- Filters on the dashboard
- Grid or carousel
- Copy or expand any chart
- One chart at a time on a phone
Start scaling
accurate data today
Free for your first 3,000 calls. No seat limits.